With the holiday season rapidly approaching, Black Friday weekend is just around the corner. Recently, we asked if your digital analytics team is ready for the all-out retail blitz that follows Thanksgiving. Today, we’re going to provide some additional tools to make sure you and your team are prepared for 2019’s biggest sales event.
Learn From Past Successes and Failures
If your organization utilized Google Analytics in 2018, you likely (hopefully) have mounds of historical data you can analyze when making your campaign and advertising decisions for 2019. In this section, we’ll explore a few reports you can view to gain valuable insight into your Black Friday weekend 2018 data.
The “Channels” Report
Some of my favorite reports I use nearly every day are the Google Analytics “Acquisition” reports—specifically, the “Channels” report. This report allows you to see exactly how all your user traffic arrived to your website.
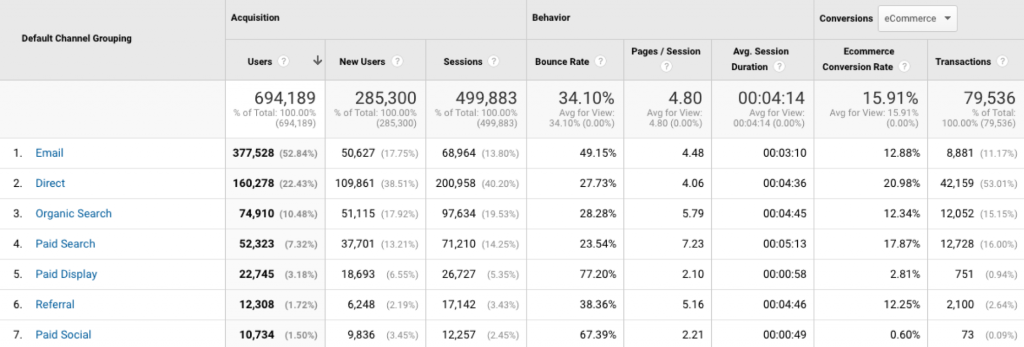
Here are a few extremely valuable metrics in this report:
Users/New Users
This metric is a very straightforward representation of your most popular channels. Curious to see how your email campaign performed? Want to see how many new users your paid search and display ads were bringing in? This metric answers those questions and helps you hone in on your 2019 strategies.
Bounce Rate
This simple metric can provide you with a lot of information. Let’s say you run a specific email campaign with a link that leads to a specific page. If you dig deeper into this interactive report, you may see a higher bounce rate on a specific landing page or campaign ID, indicating an ineffective URL. This is valuable information to have when deciding which URLs to send potential users to in hopes of a conversion.
eCommerce Conversion Rate
This is probably the most-sought-after metric in this report. The e-commerce conversion rate is the end-all number to determine how your specific channels are performing. When looking at Black Friday 2018 data, this is incredibly helpful in determining which channels resulted in a user successfully making a purchase on your site.
The “Checkout Behavior” Report
If you’ve enabled “Enhanced Ecommerce” in your Google Analytics view, you have the ability to set up labels for checkout steps.
[For more information on getting your company ready for Enhanced Ecommerce reporting, we can help! Check out an article from InfoTrust’s Amin Shawki about implementing Enhanced Ecommerce.]
An important part of understanding the customer journey is to understand when users may drop out of the checkout funnel. With Black Friday bringing in so many new users, this report allows you to clearly see where a new (vs. returning) user may be dropping out of your funnel.
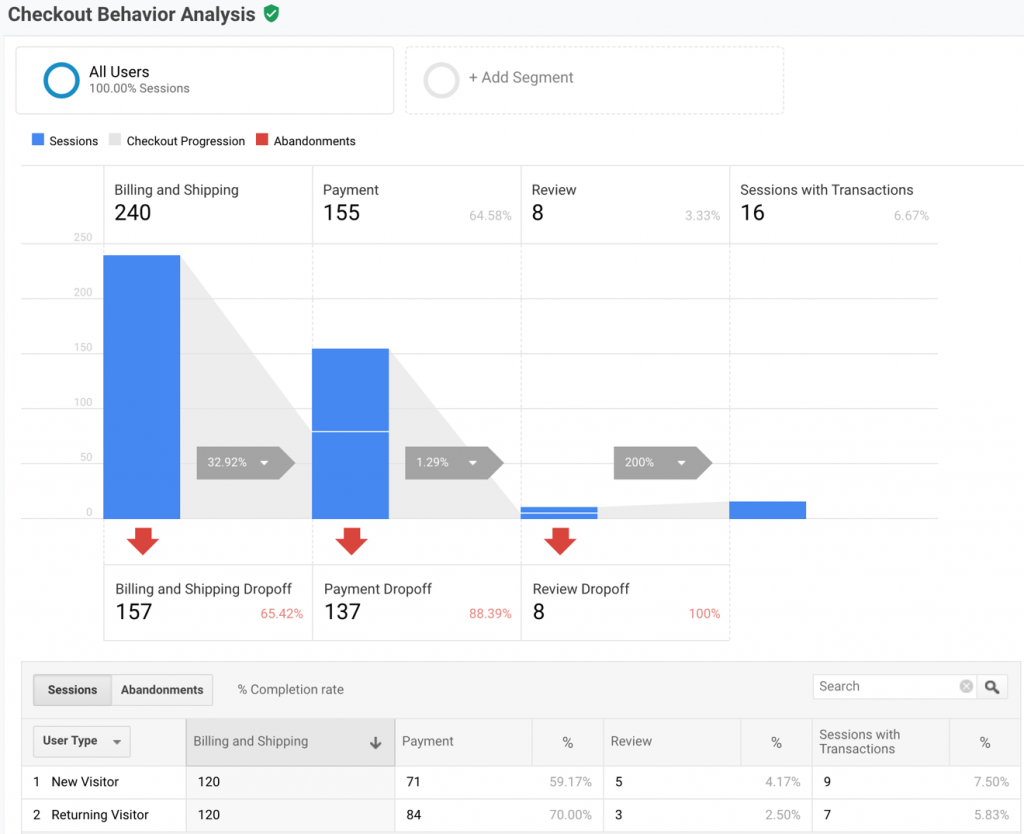
In this report, you can see where users enter the funnel and make their way through the checkout process based on your Enhanced Ecommerce setup. That said, arguably the most insightful feature of all is the ability to create an eCommerce segment based on this subset of users. These are individuals who have already committed to the checkout process, but for one reason or another, left the funnel.
Talk about valuable data! You can use these segments to retarget and hopefully bring back those users for a completed conversion. From a historical view, you can look at the highest drop-off points from 2018’s Black Friday weekend and determine where improvements can be made–or maybe even target users in hopes they return this year.
How to Analyze Your Google Analytics Data During Black Friday 2019
Now that we understand how to analyze analytics past Black Fridays, what about the present? What can you do in real-time to quickly pivot marketing strategies and stay ahead of your competition and drive revenue through November 2019 and beyond?
Google Analytics “Realtime” Report and Data Freshness
The Google Analytics “Realtime” report allows you to see how many users are actively on your page. You can see your top referrals, your highest social traffic, and most active pages. It’s a convenient tool that allows you to see a high-level view of your current users. It is incredibly useful during Black Friday weekend to see where your traffic is coming from.
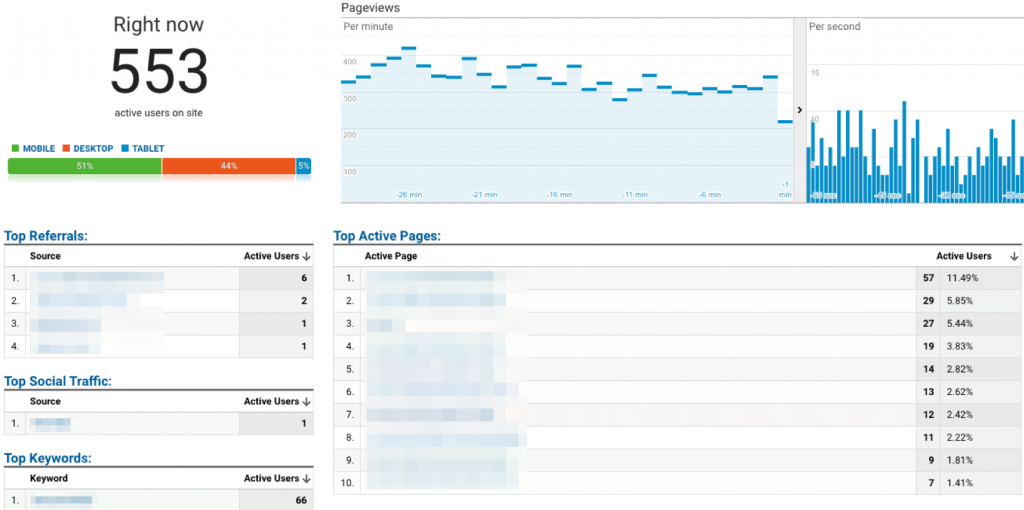
This report has limitations, however. You can’t dig deeper into your data like a normal Google Analytics report. For example, there are some incredibly-useful reports, such as the Order Coupon or Product Coupon reports, that help to track sales performance during Black Friday; how can you get this information quickly enough to pivot your marketing strategies?
With standard Google Analytics (the free version) it can take up to 24 hours for data to populate in your various reports–much too slow for many retail organizations. However, with a Google Analytics 360 license (the paid enterprise-level version of Google Analytics), that data is guaranteed within 4 hours, but averages closer to 10-20 minutes. With this advantage, you can take your marketing strategies to the next level and use nearly-real-time data to make marketing changes on-the-fly.
One Step Further: Predicting Future Revenue
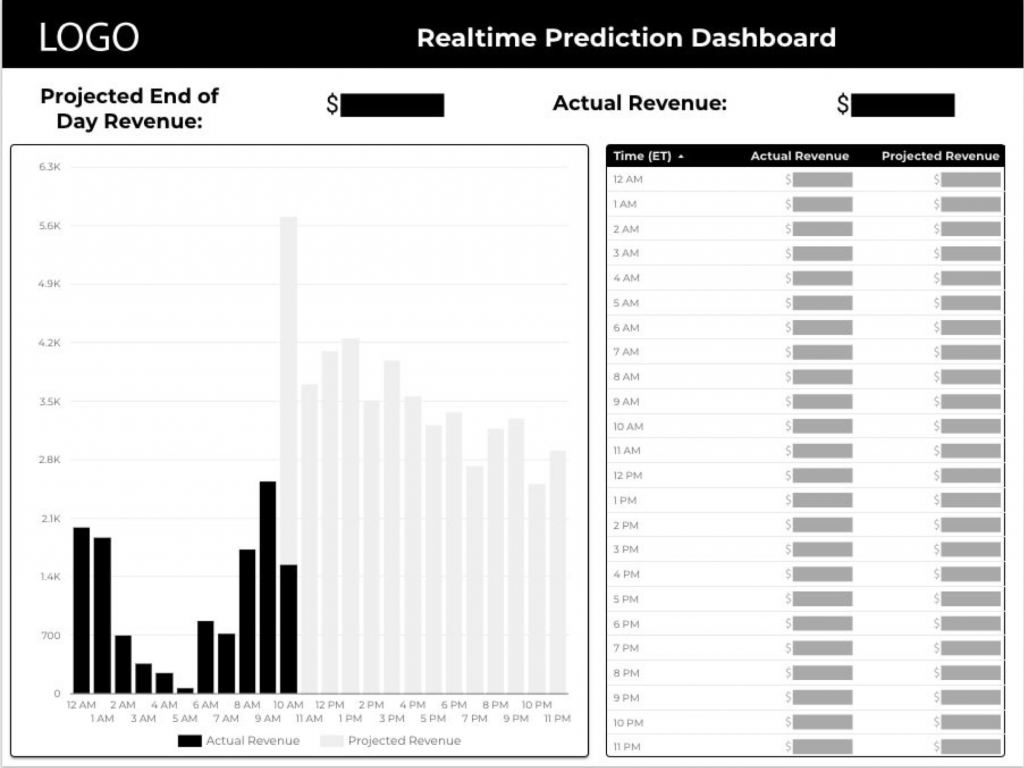
Ready to go even further with real-time data? How about predicting future revenue on your site? That’s where our data science team comes in; check out this article from InfoTrust Data Scientist Pam Castricone, featuring a real-time prediction dashboard built for an InfoTrust client.
The Time to Prepare for Black Friday is Now
Black Friday is just weeks away. By fully utilizing the analytics tools available to you, you can drive revenue, increase website efficiency, and optimize your marketing and advertising strategy.
If you’re curious about upgrading to Analytics 360 or would like more information, we encourage you to attend this webinar on Nov. 13. InfoTrust is a certified Google Marketing Platform Sales Partner, specializing in complex implementations of Analytics 360. Learn more about how Google Analytics and Analytics 360 can provide incredible value for your company if used properly with the right strategies by contacting our team today.

