

Audit, clean, rinse, repeat.
Sometimes it feels like all we do is look at data and optimize scrub-scrub in an obsessive-compulsive fashion. “Just one more pump of soap. Then I can do my reporting!”
The fact of the matter is, no matter how savvy you set up your Google Analytics configurations, the internet, data, and bot capabilities are always changing. Realistically? You’re going to have to get creative, and it may be an ongoing battle. Dive deep into the recesses of your reactive-brain (rather than your proactive-brain). It’s time to get a little messy.

So you came across some messy data. (uh oh)
Despite your best efforts—you’ve done the AWS view filters, excluded hostnames with ‘porn’ spelled in several different characters, you’ve accounted for errant security scans—bot traffic exists. If any vendor tells you they have foolproof ways of never gathering any garbage data, they’re living a fantasy world.
Nevertheless, if and when we find undesirable data, there are methods of deleting it for good, and deleting it within sections of your reporting. Here we’re going to look at a few reactive methods of identifying (and hopefully getting rid of, or brushing aside) garbage data.
How can you tell?
You found some iffy data. Let’s troubleshoot.
Assuming you haven’t made any dev, content, tagging, or campaign changes within the newly-messy time period, you may experience unexpected changes such as:
- Average session duration may have gone from 4 minutes to 0:23 seconds
- Bounce rate may have flown through the ceiling to nearly 100% (40–60% is typical)
- Traffic spikes in a sudden and unexpected, persistent rhythm
Method #1: Bot Traffic Scoring
I didn’t come up with this. But it really is brilliant. The latest version of reCAPTCHA (v3) allows bot detection and scoring attributions at a server level. You’re familiar with those (well, largely annoying) reCAPTCHA boxes that interrupt your frantically logging into that thing you were late for today? Yea, these guys:
The latest version of reCAPTCHA allows you to apply the same type of annoying verification— but without the annoyance. Your visitor never experiences anything inside of the UI. reCAPTCHA now has the ability to continuously monitor and score your hits numerically. This 1) gives you a better idea if your chunk of data is legit and 2) allows you to gather up all of the swill numbers, segment swiftly, and give their ashes to Poseidon.
Don’t let Simo Ahava’s super-genius, mammoth run-down intimidate you. You can do it! There are two different server methods, one involving a PHP file and the other .js. I can help you with either if you have questions.
Method #2: PII Detection (No One Likes to Talk About PII)
Lucas Long does a great job telling us about the importance of cleaning up PII with configuration methods and products alike. But I’d like to share an understated method of getting rid of PII data. (Ok, fair, you will have to do some proactive work to identify it, but once you do, you’ll be thrilled to see it working for you—in the unfortunate event that you need it.)
Step 1: Collect Client ID as a Custom Dimension
Please, please, please do not neglect this. Client ID is the random assignment of numbers that Google Analytics assigns to your browser’s local storage. It’s already stored in Google Analytics, but you cannot get to it out-of-the-box! (Not unless you store it as a custom dimension.)
So here’s an example: you collected an Event Category Label.
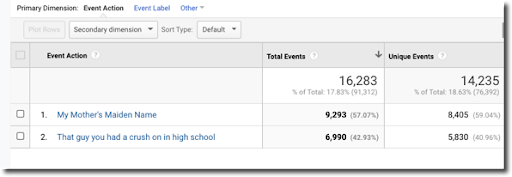
Step 2: Find the Client ID associated with PII
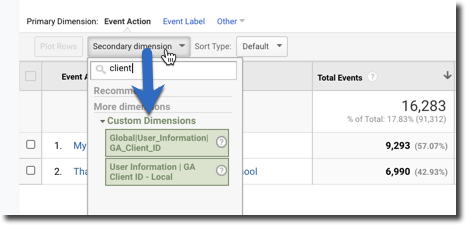
If you are capturing Client ID as a Custom Dimension, you can add this as a secondary dimension to your event report.
Step 3: Get rid of it
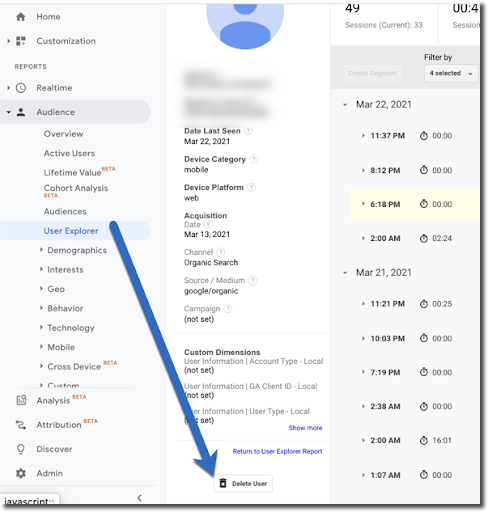
Copy those Client IDs associated with this PII, take it to the crematorium (your User Explorer report tab), and smolder those bad boys.
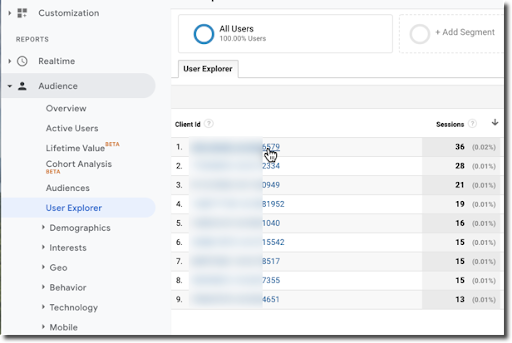
To do this, simply paste the Client IDs associated with PII that you discovered earlier, click into the ID in the User Explorer report (above), then scroll to the bottom left and BURN IT WITH FIRE (or just click delete).
Method #3: Narrow Your Data from the Top Down
If you ask me (and you shouldn’t, cause I’d love to take credit), I invented this one.
Let’s pretend you didn’t set up your Client ID as a Custom Dimension and you aren’t using reCAPTCHA v3. Here’s the rest of the scenario:
You woke up Monday morning and received a Google Analytics Alert email telling you that sessions went from 230 daily average to 3,000 daily average last Wednesday. There have been no major campaigns, no recent dev releases, and you haven’t migrated content.

Here are some ways to go about identifying and isolating what is (likely) bad data, and then officially filter it out of your reports.
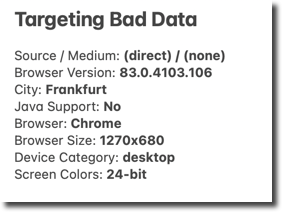
Typically, bot or spam traffic carries with it a smattering of other dimensions which populate your bloated session count. Meaning, if you have a bot infestation, it will usually generate a value for most of the following dimensions:
- Browser
- Browser Version
- City ID
- Country
- Landing Page
- Language (by the way, ‘c’ language is not ‘Canadian’ it means ‘computer,’ aka, BOT!)
- Operating System
- Device
- Operating System Version
- Screen Resolution
- Flash Version
- … and more!
The trick is to find the exact combination of data which accounts for 100% of your suspected bot traffic. The more specific you can make it, the better.
For instance, even if you knew that bot traffic was coming from Safari version 11.1.2, you wouldn’t want to apply a filter which got rid of all Safari Version 11.1.2. Yes, you may be getting rid of all of the bot traffic, but at the same time you may be getting rid of 10% of your legitimate traffic (Ok, maybe <1% … BURN NOTICE, Safari! That’s for ITP. But I digress …).
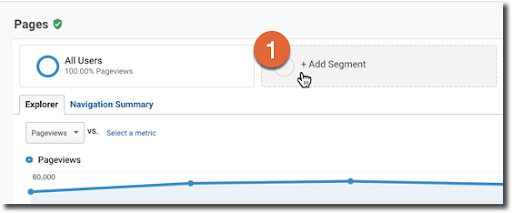
To test out your combo of values, and to see if your theories hold water, dig into your reports, grab a pencil and paper, and write down dimension values which correspond to nonsense or inflated data. This is where your detective-work comes into play! Once you have your theory, head over to the top of your Reporting interface and click Create New Advanced Segment:
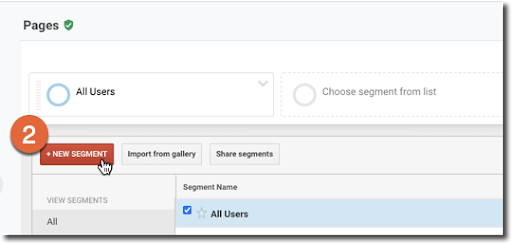
Click “+ New Segment”
Next, click “Conditions” in the Advanced section of the left-hand menu:
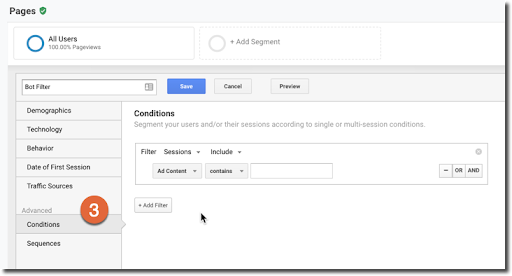
At this point, grab some of the dimension and metric values you’ve written down along the way. Your list may look something like this:
Be sure to use the “and” functions, between each metric and dimension, rather than “or”. Otherwise your logic won’t work. Start applying this to your Advanced Segment. You WON’T be permanently changing any data, so feel free to take some risks. It won’t bite.
Tip: I like to start building this segment as “include” only, and not exclude. Why? Because if you come up with five or six perfectly aligned dimension values that account for 100% of the bot traffic, you then can look through reports with ONLY bot traffic and see if there are MORE specific dimension values you can apply. The more specific, the better, more focused your exclusion will be for reporting—and, the more likely you won’t be getting rid of legitimate traffic.
What about you? Do you have any other tried and true, possibly hidden, or little-known methods of kickin’ those bots to the curb? Hit me up!