In November of 2005, Google unveiled a product that would ultimately revolutionize the way marketers the world over made decisions. It provided in-depth insights into site traffic and user behavior. It revealed hidden gems and literal money pits in terms of advertising channels. It did all of this for free and with only the addition of a few lines of code to a website. We’re talking of course about Google Analytics… and you have to admit, it’s pretty impressive. After all, did you change the world before your 10th birthday?
For all the street cred Google Analytics deserves (and we think it deserves a lot), it isn’t perfect right out of the box. To be fair, what product is?
In the nearly 10 years since the introduction of Google Analytics, the digital world has expanded into a nearly unrecognizable landscape. There are now more ways than ever for businesses to connect with potential customers, and because of that, Google Analytics needs a little tweaking in order for businesses to make the best data-driven decisions.
So, in the words of Howard Wolowitz, “Play time’s over… let’s open this baby up!â€
Bonus: You don’t have to have a masters degree in engineering to succesfully customize your Google Analytics implementation!
Cowan’s Auctions: A Real Life Example
The power of customization in Google Analytics can be seen in the case of Cowan’s Auctions. In brief, by upgrading Cowan’s implementation to Universal Analytics, utilizing Google Tag Manager, and taking advantage of opportunities for customization, InfoTrust was able to help Cowan’s achieve a:
- 42% increase in online bidding in the first 30 days following implementation.
- 163% increase in bids via strategic decisions informed by Google Analytics.
- 185% increase in bid values via strategic decisions informed by Google Analytics.
The details of this implementation can be found in the case study published by Google, Cowan’s Auctions Leverages Google Analytics for Scalability and Custom Insights.
Here is a closer look at some of the features utilized:
Custom Dimensions and Metrics

Custom dimensions and metrics allow you to track “extra†data points that wouldn’t otherwise be available in Google Analytics. These are pieces of data, independent of Google Analytics, that you believe are important to your business. For example, Cowan’s Auctions used a custom dimension of “bidder id†and a custom metric of “number of bidsâ€.
Obviously, which custom dimensions and metrics you want to track will depend on your business and goals. You can use custom dimensions and metrics in conjunction with “standard†Google Analytics data to help you make accurate decisions.
Each free Google Analytics account can have 20 custom dimensions and 20 custom metrics.
Tip: When deciding what custom dimensions and metrics to track, it is important to understand the difference between dimensions and metrics. Dimensions are characteristics that can be used to describe a user (ex. city) and metrics are quantitative measurements (ex. sessions).
For more information read Custom Dimensions & Metrics by Google.
Demographics and Interests Reports
This is perhaps the easiest “custom†modification to make to Google Analytics; however, many businesses overlook it. The demographics and interests reports allow you to gather information about users such as:
- Age – shown in ranges (ex. 18-24, 25-34, etc.)
- Gender
- Affinity Categories – places users in high level categories such as “sports fans†and “cooking enthusiastsâ€
- In-Market Segments – segments users by their product-purchase interests
- Other Categories – provides a more detailed look at users’ interests
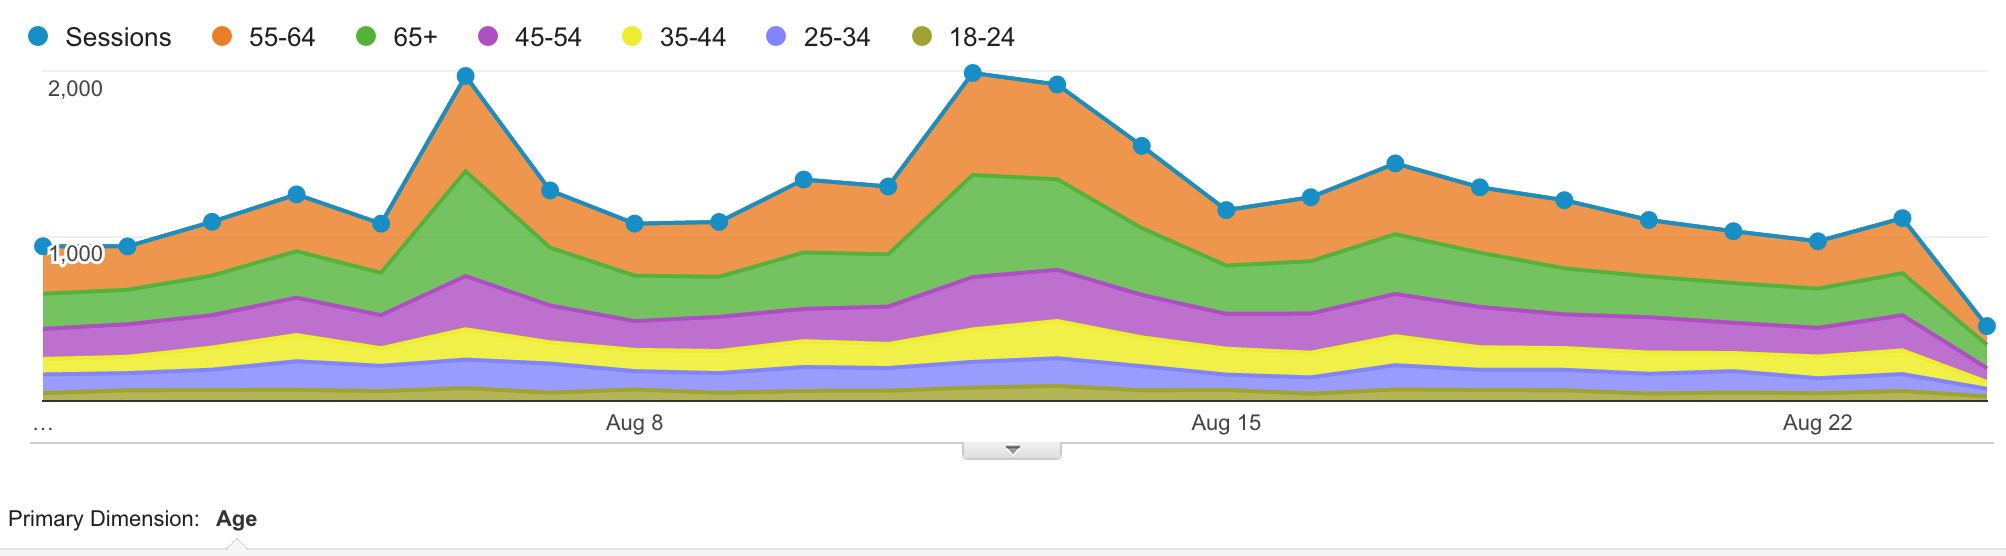
Demographics and interests reports allow you to better understand your audiences and make smart advertising and content decisions.
Enabling these reports is about as easy as 1, 2, and 3. To learn how to enable demographic and interests reports in your Analytics’ account check out Google’s Enable Demographics and Interests Reports help article.
Custom Reports
By default, Google Analytics includes many helpful reports such as “Source/Medium†under Acquisitions which lets you see where traffic is coming from. However, as you start customizing your implementation, there is additional data you’ll want to see (ex. custom dimensions and metrics) that isn’t readily accessible. That’s where custom reports come in.
Custom reports are pretty straightforward to build; however, many businesses skip them because the interface and lingo can be a little intimidating.
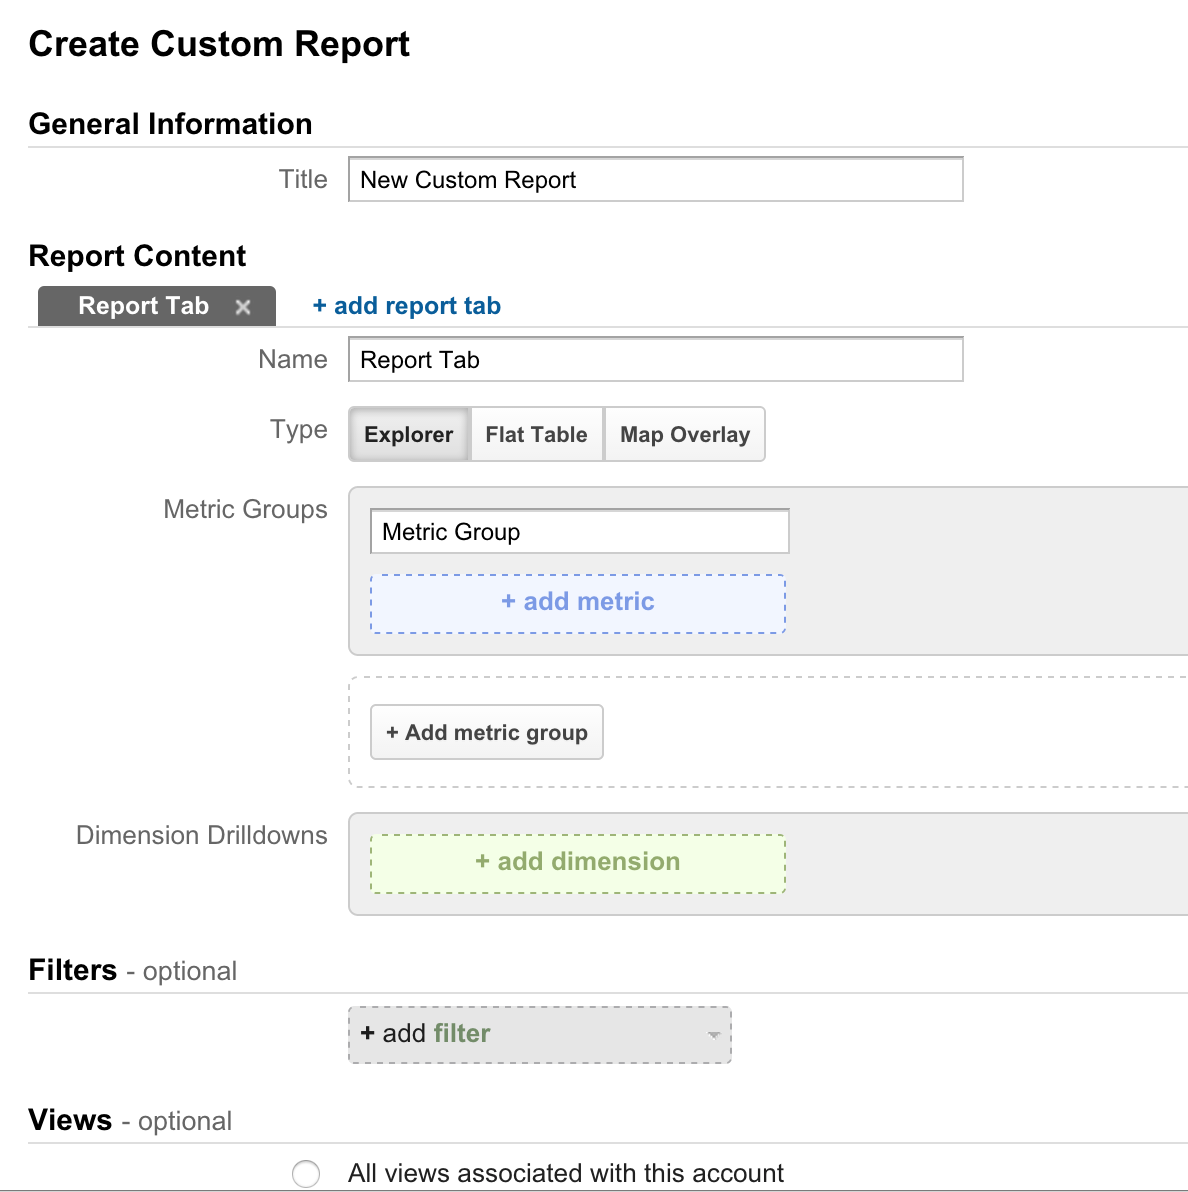
To get to your custom reports, simply go to the “customization†tab in Google Analytics. From here you can create, edit, or view custom reports.
Here’s some assistance direct from Google on creating and managing custom reports.
Tip: The possibilities with custom reports are practically endless; you can build just about anything you can dream up. Don’t get bogged down creating hundreds of reports no one will ever use. Instead, brainstorm what information is the most important and create very specific reports that provide actionable information.
For example, a custom report for Cowan’s Auctions displayed the following by “Channel†(ex. email, referral, social, etc.):
- Sessions
- Users
- New Users
- Absentee Bid Placed (Conversion Rate)
- Timed Bid Placed (Conversion Rate)
- Number of Bids
- Bid Amount
Another example of a custom report would be to look at content (ex. blog posts) by hour and day to see when the most traffic and conversions are occurring.
Custom Dashboards
Dashboards are just a collection of widgets (reports) that allow you to get a quick overview of the data you think is the most important. Think of it like the dashboard in a car or in the cockpit of a plane … you can see a lot of information all with a quick glance such as speed, fuel level, miles traveled, etc.

Dashboards allow you to basically check up on your account in one place without clicking all around the Analytics’ interface. They also allow you to view multiple data points from one screen and look for correlations or patterns.
An account can have multiple dashboards (up to 20) which is helpful in creating categories of information. For example, with Cowan’s Auctions, InfoTrust created a dashboard just for information about absentee bids.
To learn how to create and manage dashboards in your account see this Google Analytics help article.
If you’re not sure what should be in your custom dashboard, take some time to think about the reports you view the most. If there’s a handful of reports you’re looking at on a daily or weekly basis they should probably be in a dashboard. However, if you’re still stuck, check out Google Analytics Solutions Gallery for free dashboards you can use to get started.
Data Import
Google Analytics allows you to import data from outside sources and analyze it along with the “standard†Google Analytics’ data. For example, you can bring in cost data from other marketing channels such as Facebook. This feature allows you to obtain a comprehensive view of your business.
This ability to see the big picture from within one tool (Google Analytics) will provide context and help you truly evaluate all the data you’re collecting from multiple sources and better align your marketing efforts with your business needs.
Read About Data Import from Google Analytics for more details on this feature.
You can import data into Google Analytics by uploading a CSV file or by tapping into the Google API. While uploading a file isn’t horrifically difficult, it can be time consuming. You’ll need to create the file from your other data source (ex. Facebook), clean it up to fit Google’s needs, and then upload it. You’ll have to do this each time you want to import data. Utilizing Google’s API will require developer resources.
However, there is a third option… use a tool such as Analyze.ly.
![]()
Analyze.ly simplifies the data import process. You can automatically import cost data from Facebook, Bing, and other sources. Plus, you can easily bring in data from custom sources as well.
Long Story Short
Google Analytics is a pretty amazing product; however, it isn’t perfect right out of the box. To achieve success with your data, you’re going to need to get your hands dirty and do some customization. Some opportunities for customization include:
- Custom dimensions and metrics – allow you to track extra data not automatically available in Analytics.
- Demographics and interests reports – allow you to discover additional information about your site’s audience(s).
- Custom reports– allow you to drill down, utilize custom dimensions and metrics, and look at information in a way not readily available in the standard reports.
- Custom dashboards – allow you to categorize reports into widgets and see them all in one place.
- Data import – allows you to bring in “outside†data from your CRM, Facebook, Bing, etc. and analyze it in context with Google Analytics’ data.
By utilizing these custom features, you’ll be able to unify your data across multiple platforms and make fast, savvy data-driven decisions.
To see how InfoTrust successfully used these opportunities for customization to benefit Cowan’s Auctions, read the Google case study Cowan’s Auctions Leverages Google Analytics for Scalability and Custom Insights.
