First, lets begin by discuss what sampling is. According to Wikipedia:
In statistics and survey methodology, sampling is concerned with the selection of a subset of individuals from within a population to estimate characteristics of the whole population.
Researchers rarely survey the entire population because the cost of a census is too high. The three main advantages of sampling are that the cost is lower, data collection is faster, and since the data set is smaller it is possible to ensure homogeneity and to improve the accuracy and quality of the data.
However, for some unfortunate reason, my geeky passion towards math, statistics and other engineering sciences are seldom shared by my friends and colleagues so if you spent your college years in anything other then classes on statistics, allow me to translate what this means.
Lets assume that your website generates a lot of traffic. Even though a product like Google Analytics collects all your website’s traffic data, it would take a significant amount of time to generate reports based on the complete set of data. Instead, the tool takes a subset of your data and presents a report based on a sample of the data, not the whole thing.
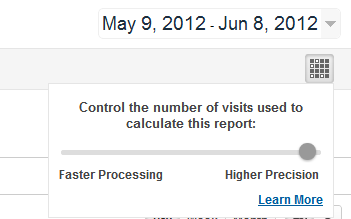
Up until recent it wasn’t possible to control sampling. If your data was sampled, you’d see the following message:
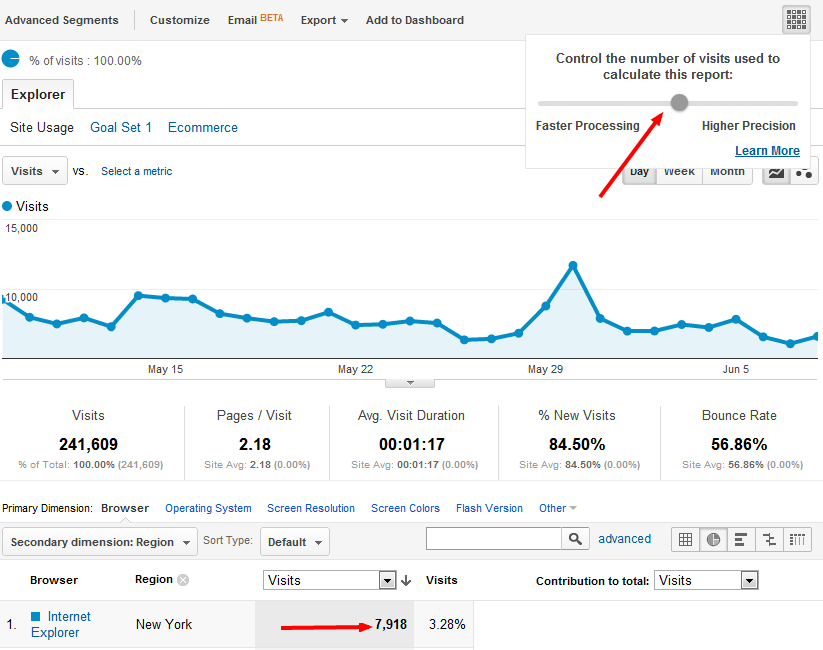
A new feature in Google Analytics is the Adjust Sample Size tool. The slider, which is located below the date range, allows the user to choose between faster processing and higher precision. You can adjust the sample size from the default of 250,000 (which is the center of the slider) up to 500,000 visits. When you choose a sampling threshold, that preference will be used in all reports until you close Google Analytics.
When does Google Analytics use data sampling
Google Analytics samples data when your requested data size meets one of the conditions:
-
- 500,000 maximum sessions for special queries where the data is not already stored.
-
- Any query that exceeds 1,000,000 unique dimension combinations.
Why should I worry about this
Data sampling may lead to inconsistent results when you run Google Analytics reports. Here is a real-life example:
When the scaling is set to ‘Faster Processing’ the report is built based on 981 visits and shows 9,605 IE visits from the state of NY.
Keeping everything the same, when the sampling is set to the middle of the scale, the number of IE visitors from the State of NY drops significantly to 7,918.
Finally, for this example, the highest and the average precision yield the same result for IE visitors from the State of NY – 7,918.
Why were the results the same between the average and the high precision? Be the first to comment below or send us a note with your answer, and if you’re right we’ll send you an InfoTrust SuperHero T-shirt.
What can I do about it
If you are concerned about the effect of data sampling, you have a couple of options:
1. You can make a change to GATC to only collect a percentage of your site’s traffic rather than all the traffic. We will cover more technical details in the next post on this subject.
2. Reduce your date range so you have less data.
3. Upgrade to Google Analytics Premium. We are working on a post about GA Premium, so stay tuned!
If your site gets more than 10M hits per month.
First of all, congratulations! Now, you should keep in mind Google Analytics Terms & Conditions state that ”if you exceed more than 10 million hits per month, there is no assurance that the excess hits will be processed.” We are going to talk about your options in a future post, but for the purposes of our discussion about sampling, we will assume that you have a Free Google Analytics account and your traffic is under 10M hits per month. If not, and if you have any questions, don’t hesitate to reach out to me at Alex@InfoTrustLLC.com.
Stay tuned as we are going to publish another blog post on more advanced topics associated with sampling. Meanwhile, here are some good resources on this subject:


