Tips for Building an Effective Analytics Dashboard

Building Dashboard in Google Data Studio
Estimated Reading Time: 3 minutes

Building an effective dashboard is tough work. I find most clients struggle when trying to build a dashboard internally due to a lack of agreement around what should go into it. Sure, there are also technical challenges, but I can’t count the number of times I’ve been told in my career to build a dashboard for an entire business unit (or even company) with little to no guidance from the stakeholders. Usually, either I as an analyst should “just know” what reports they normally look at or, more likely, nobody has the time to stop and provide input.

Unfortunately there’s no real way around this, and often times stakeholders have strong opinions about what should be included months after the dashboard is complete. However, with that in mind, I still find it helpful to document the why behind what I’m building.

If you’re struggling with input from stakeholders, create your own version of a framework below and share it back with them. Ideally you can get an idea if what you’re covering in a dashboard is what they actually want to see or answers their immediate business questions.
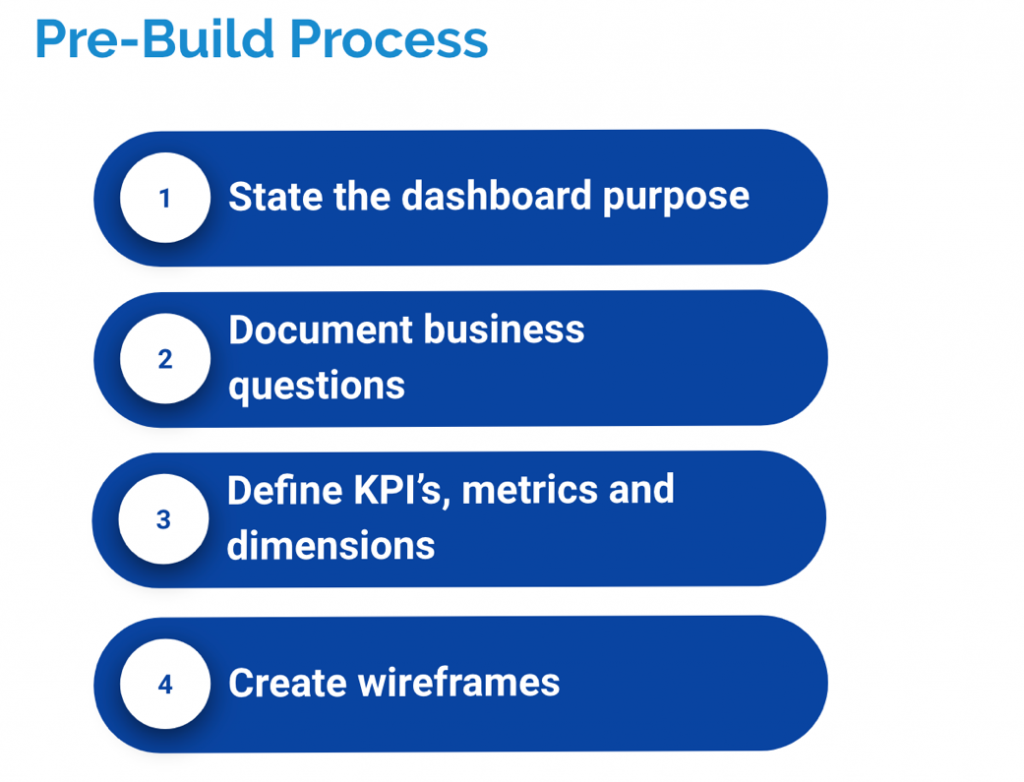
dashboard pre-build process

When you’re creating your wireframes or actually going through building the dashboard there are a couple of things you can do to help ensure your success. First prioritize what you’re putting in your dashboard. I like to divide my dashboard real estate into four quadrants, understanding that most people read a dashboard in a Z pattering starting in the top leftmost corner.
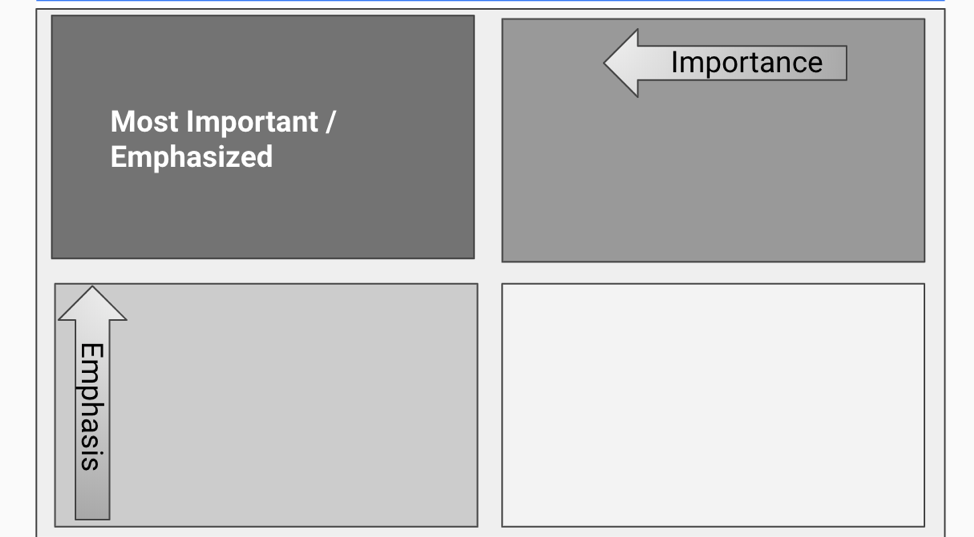
most important emphasized dashboard

Next be deliberate in your pre-attentive attributes; these are the visual elements of a dashboard that the subconscious mind picks-up on before starting to think about the numbers. It’s the short mental homework that we don’t even think about that draws our attention to what’s good or bad about the reporting. Attributes like color/hue, size, or added marks (like up or down arrows) are incredibly important to be deliberate about.

For example, in the dashboard above, the use of stoplight colors in the table on the left may leave stakeholders with the immediate impression that bounce rate (red) was bad while pages per session (green) is good. In reality, the person who designed this dashboard just wanted to break up the columns in the table with color and made an unfortunate choice. Meanwhile, the table on the right uses red bars to highlight poor performance, but there’s not enough context to understand why. 

Building an effective dashboard is a moving target, because how people think about their business changes over time. However ,with a little bit of pre-work and attention to detail, you’ll be able to build the best version of the dashboard with what you have to work with.

Need Dashboarding Help?

If you're ready to take your analytics dashboards to the next level, contact the experienced team at InfoTrust.

Author

Facebook
Twitter
LinkedIn
Email
Originally Published: October 1, 2019

Subscribe To Our Newsletter

October 1, 2019

Other Articles You Will Enjoy

Google Analytics 4 Implementation Checklist: Ensure You’re Tracking Everything You Need

Google Analytics 4 Implementation Checklist: Ensure You’re Tracking Everything You Need

In the dynamic landscape of digital marketing, data is supreme. Understanding user behavior, preferences, and interactions on your website is crucial for making informed…

4-minute read
App Install Attribution in Google Analytics 4: What You Need to Know

App Install Attribution in Google Analytics 4: What You Need to Know

App install attribution in Google Analytics for Firebase (GA4) is a feature that helps you understand how users discover and install your app. It…

6-minute read
Leveraging Custom Dimensions and Metrics in Google Analytics 4 for Content Performance Measurement: Best Practices and Real-World Examples

Leveraging Custom Dimensions and Metrics in Google Analytics 4 for Content Performance Measurement: Best Practices and Real-World Examples

In today’s digital landscape where content reigns supreme, understanding how your audience interacts with your content is paramount for success. For news and media…

5-minute read
Leveraging Attribution Models in Google Analytics 4 to Improve Your Marketing Strategy: Tips and Best Practices

Leveraging Attribution Models in Google Analytics 4 to Improve Your Marketing Strategy: Tips and Best Practices

In the dynamic landscape of digital marketing, understanding the customer journey is crucial for optimizing strategies and maximizing ROI. Google Analytics 4 (GA4) introduces…

5-minute read
Deploying Digital Analytics Changes at Scale for CPG and Multi-Brand Organizations

Deploying Digital Analytics Changes at Scale for CPG and Multi-Brand Organizations

The digital analytics industry is going through seismic shifts, and it is important for CPG organizations to stay abreast of the changes and stay…

5-minute read
Is It Time to Upgrade? 4 Signs Your Organization Needs Google Analytics 4 360

Is It Time to Upgrade? 4 Signs Your Organization Needs Google Analytics 4 360

As VP of Partnerships at InfoTrust, I’ve had the opportunity to talk with hundreds of decision-makers about their interest in upgrading to Google Analytics…

4-minute read
How Data Maturity Can Cultivate a Data-Driven Culture

How Data Maturity Can Cultivate a Data-Driven Culture

Data-driven decisions are a buzz topic in Martech. It is essential for C-suite executives to understand and more importantly, use their data to move…

4-minute read
How to Integrate Google Analytics 4 with BigQuery for Enhanced Data Analysis and Reporting

How to Integrate Google Analytics 4 with BigQuery for Enhanced Data Analysis and Reporting

Has your business found that its reporting needs require advanced analysis of your analytics data beyond what is practical in the Google Analytics 4…

4-minute read
How Does BigQuery Data Import for Google Analytics 4 Differ from Universal Analytics?

How Does BigQuery Data Import for Google Analytics 4 Differ from Universal Analytics?

All Google Analytics 4 (GA4) property owners can now enable ‌data export to BigQuery and start to utilize the raw event data collected on…

2-minute read

Get Your Assessment

Thank you! We will be in touch with your results soon.
{{ field.placeholder }}
{{ option.name }}

Talk To Us

Talk To Us

Receive Book Updates

Fill out this form to receive email announcements about Crawl, Walk, Run: Advancing Analytics Maturity with Google Marketing Platform. This includes pre-sale dates, official publishing dates, and more.

Search InfoTrust

Leave Us A Review

Leave a review and let us know how we’re doing. Only actual clients, please.