Web analytics tools are terrific for understanding web traffic trends throughout time. While trends are valuable for making informed marketing decisions, understanding higher traffic periods of time and why they might exist could help bring even more clarity to your web traffic data. Google Analytics allows you to see the data by different time parameters such as month, week, day, and even hour of the day. Below is an explanation of how to see these views as well as a few custom reports you can use to see your website’s most visited times.
Why knowing the time most web traffic occurs is useful
The primary reason why knowing the month, day, and hour when most traffic comes your site is for optimal content publishing. Here’s a real world example. A local community college checks their analytics and notices the majority of their visitors came to their site during spring months and started leveling out during summer months, then dropping off in fall months. When cross-referencing this data with referrals or keywords searched in the same time period, they realized that the content they were publishing throughout the year wasn’t really valuable until the spring months when students were looking for where to go to school the upcoming year. Before this, the school administration thought the best time to actively publish content and recruit was during the early summer.
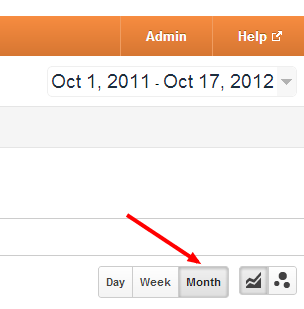
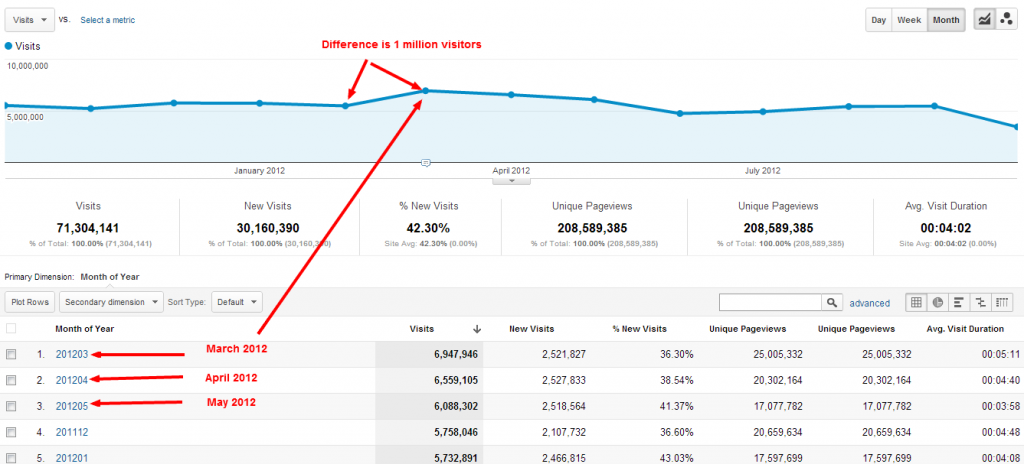
A quick tip is to change the view of any standard report to see the traffic report by month, but make sure to have a long enough time period set in the date drop down.
Now, using the Most Traffic by Month Custom Report (download link below), you can see the breakdown of most visits by month.
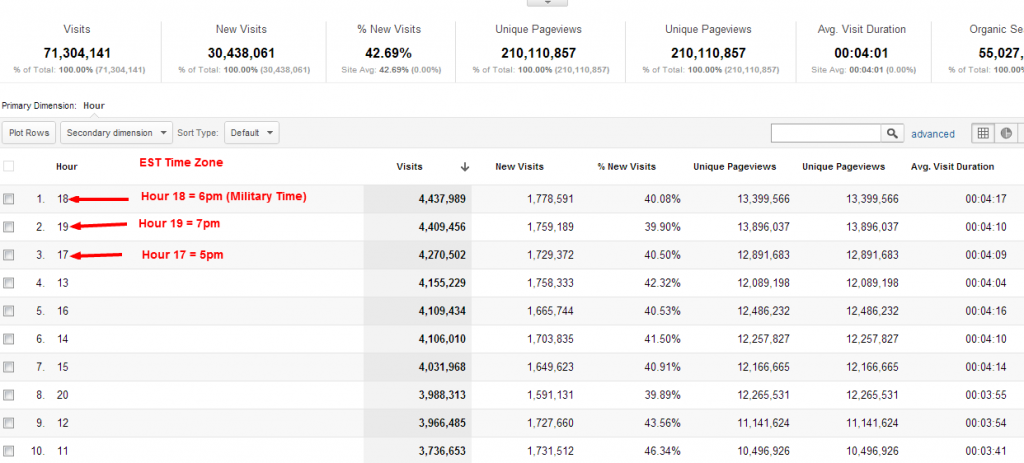
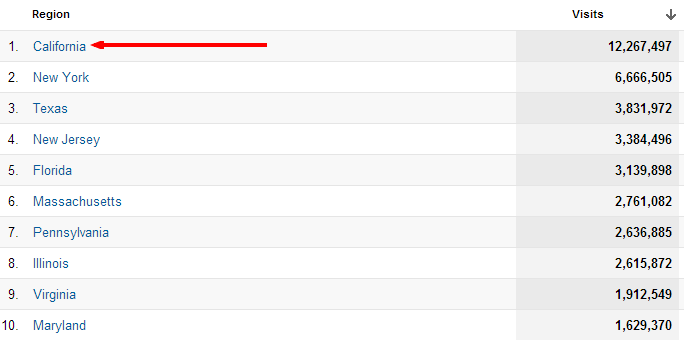
Here’s another example. A local coffee shop (EST time zone) looks at their web analytics to see what day they should publish their weekly newsletter on their website. They realize that between 6-8PM during the week, traffic is at its highest for viewing the newsletter, even though they published it during normal business hours. How does this happen? Well, from this insight, the local company decides to also check the location of most visitors during that time frame and realize that many of their readers and visitors are coming from California, perhaps from another coffee-enthusiast community. This can be useful because knowing who your audience is and when is the best time to publish content to them can really drive engagement and following. It can also let you know that your target audience is not seeing your content, in this case, the local EST time zone coffee-enthusiasts.
Using the Most Traffic By Hour Custom Report (download link below), you can see the breakdown of when visitors are coming to your page. 
Then cross referencing that with the Audience, Demographic, Location Standard Report, you can see the correlation. 
So there it is, more ways to analyze your web traffic. Below are the links to the custom reports mentioned in this post so you can use them on your own Google Analytics, all you have to do is click the links and specify which profile you want the report to be used on.
InfoTrust Custom Report: Months Most Visited
InfoTrust Custom Report: Days Most Visited
InfoTrust Custom Report: Hours Most Visited
There are so many tips and tricks with Google Analytics that anyone can use to get a better grasp of what their data is saying, in order to make even better marketing decisions. If you have any questions or for more information, don’t hesitate to reach out to us at info@infotrustllc.com.


