Using Visitor Flow Feature in Google Analytics and Why It's Valuable

Estimated Reading Time: 3 minutes

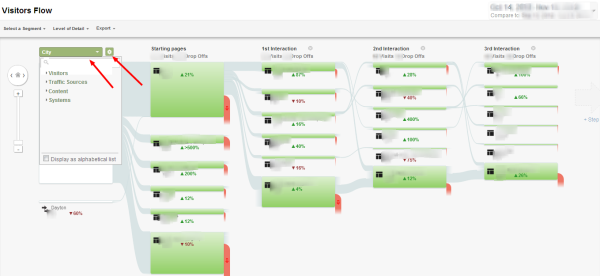
Understanding visitor behavior and navigation through your website is useful, sure, but it can be difficult to really visualize the actual path your website visitors take.  This is where the Google Analytics Visitor Flow Report can be very helpful.

According to Google Analytics’ official siteVisitor Flow is a graphical representation of the paths visitors took through your site, from the source through the various pages, and where along their paths they exited your site.

This visualization lets you see:

  • The relative volume of visits to your site by the dimension you choose (e.g. traffic sources, campaign, browser)
  • The relative volume of page views per page or collection of pages
  • Specific metrics for connection paths, the starting page and interaction pages and exits that occured at any step of the way

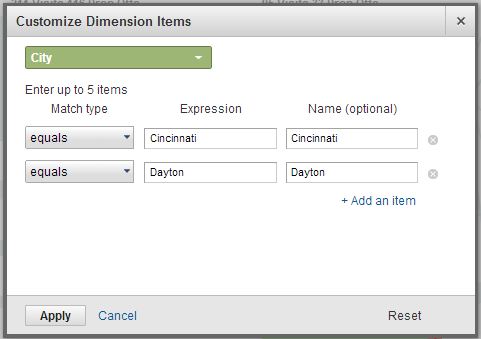
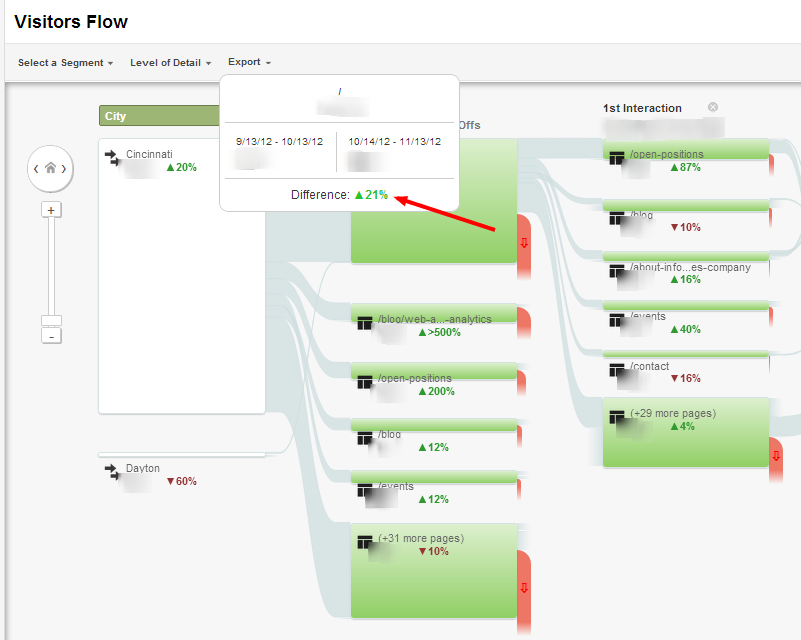
By clicking the Dimension drop down you can select a new dimension and see visitor traffic flow based off that dimension.  Furthermore, if you click the Setting Gear, you can isolate which specific type of traffic you want to see based off a dimension.  For example, instead of seeing all cities in your Visitor Flow, you can select up to 5 specific cities and see that traffic (See example below for Cincinnati and Dayton)

Visitors Flow Google Analytics Report

Settings Dimension Drop Down Visitors Flow

To get to the Visitor’s Flow, click the Audience panel on the left side bar then click Visitor’s Flow option.

Why this is Valuable

Besides being visually easier to understand web traffic flow on your site, visitor’s flow allows for deeper insights to your traffics progression and can give higher level data when it comes to your web analytics.  Some valuable tips when using the Visitor’s Flow report:

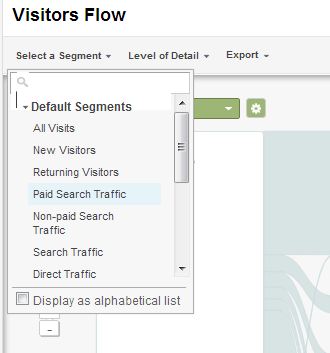
  1. Selecting a segment.  This can allow for a bit more breakdown of the traffic flow, by looking at the correlation between a specific segment using a specific dimension.

Segments Drop Down Visitors Flow Google Analytics

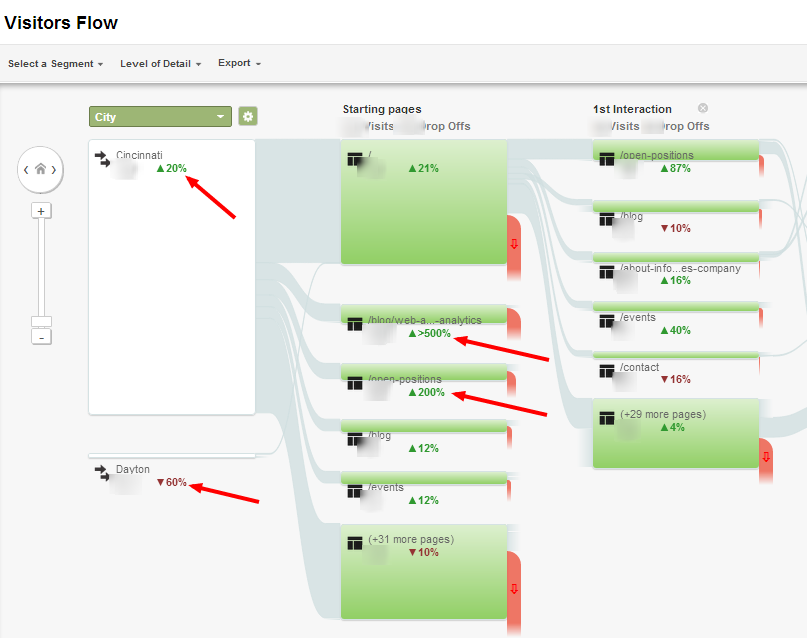
  1. Comparing time periods.  If you want to see how navigation through the site has changed through time, the Visitor’s Flow report can show just that.  Use the time set drop down as you normally would in the top right corner of the report then see how each portion of the visitor’s flow report now has an upward green triangle with a percentage (symbolizing traffic increase) or downward red arrow percentage (symbolizing traffic decrease).  Now when you hover over the source, starting page or interaction, you will see the comparison of traffic between time periods.

 Compare Time Visitors Flow Google Analytics No Hover

 Compare Time Visitors Flow Google Analytics

  1. Other cool tips with Visitor’s Flow can include the Level of Detail (Adjusting the number of connections displayed in the graph), the zoom + next interaction buttons to see deeper engagement of visitors, and of course the Export to PDF feature, for sharing.

Visitor’s Flow can give you a wonderful visual about how your audience and website visitors navigates through your site, but always remember to segment your traffic and use multiple dimensions to see the correlation between the two.  You might be surprised at just what kind of meaningful insights you can uncover with this data.  My next post will be on a similar subject, that is Goal Flow visualization (similar to Visitor’s Flow but in respects to steps taken toward Goal completions).  For any questions or comments, don’t hesitate to reach out to me at amin@infotrustllc.com.

 Article Written by Amin Shawki

Author

  • Amin Shawki

    Amin is Head of Growth at InfoTrust and comes from humble beginnings as a Social Media Intern. Wearing multiple hats and having had multiple roles, including most notably starting and leading the expansion in Dubai, UAE for InfoTrust, Amin enjoys working with the international team across many different clients and projects to drive growth and new innovations for the company. Never against a chill night playing some Settlers of Catan but always up for an adventure to try new things.

Facebook
Twitter
LinkedIn
Email
Originally Published: November 19, 2012

Subscribe To Our Newsletter

October 23, 2023
Originally published on November 19, 2012

Other Articles You Will Enjoy

How Does BigQuery Data Import for Google Analytics 4 Differ from Universal Analytics?

How Does BigQuery Data Import for Google Analytics 4 Differ from Universal Analytics?

All Google Analytics 4 (GA4) property owners can now enable ‌data export to BigQuery and start to utilize the raw event data collected on…

2-minute read
Google Analytics 4 Implementation Checklist: Ensure You’re Tracking Everything You Need

Google Analytics 4 Implementation Checklist: Ensure You’re Tracking Everything You Need

In the dynamic landscape of digital marketing, data is supreme. Understanding user behavior, preferences, and interactions on your website is crucial for making informed…

4-minute read
Deploying Digital Analytics Changes at Scale for CPG and Multi-Brand Organizations

Deploying Digital Analytics Changes at Scale for CPG and Multi-Brand Organizations

The digital analytics industry is going through seismic shifts, and it is important for CPG organizations to stay abreast of the changes and stay…

5-minute read
Leveraging Custom Dimensions and Metrics in Google Analytics 4 for Content Performance Measurement: Best Practices and Real-World Examples

Leveraging Custom Dimensions and Metrics in Google Analytics 4 for Content Performance Measurement: Best Practices and Real-World Examples

In today’s digital landscape where content reigns supreme, understanding how your audience interacts with your content is paramount for success. For news and media…

5-minute read
Advanced Analysis Techniques in Google Analytics 4: How to Use AI-Powered Insights and Predictive Analytics for Effective Marketing

Advanced Analysis Techniques in Google Analytics 4: How to Use AI-Powered Insights and Predictive Analytics for Effective Marketing

AI-powered insights and predictive analytics are revolutionary tools reshaping the modern marketing landscape. These advanced analytics techniques, particularly prominent in Google Analytics 4 (GA4),…

8-minute read
What Is Consent Mode in Google Analytics 4 and How Does It Work? | A Beginner’s Guide

What Is Consent Mode in Google Analytics 4 and How Does It Work? | A Beginner’s Guide

Consent Mode in Google Analytics 4 (GA4) is a helpful tool for website owners to respect user privacy preferences when it comes to tracking…

3-minute read
App Install Attribution in Google Analytics 4: What You Need to Know

App Install Attribution in Google Analytics 4: What You Need to Know

App install attribution in Google Analytics for Firebase (GA4) is a feature that helps you understand how users discover and install your app. It…

6-minute read
How to Integrate Google Analytics 4 with BigQuery for Enhanced Data Analysis and Reporting

How to Integrate Google Analytics 4 with BigQuery for Enhanced Data Analysis and Reporting

Has your business found that its reporting needs require advanced analysis of your analytics data beyond what is practical in the Google Analytics 4…

4-minute read
How Data Maturity Can Cultivate a Data-Driven Culture

How Data Maturity Can Cultivate a Data-Driven Culture

Data-driven decisions are a buzz topic in Martech. It is essential for C-suite executives to understand and more importantly, use their data to move…

4-minute read

Get Your Assessment

Thank you! We will be in touch with your results soon.
{{ field.placeholder }}
{{ option.name }}

Talk To Us

Talk To Us

Receive Book Updates

Fill out this form to receive email announcements about Crawl, Walk, Run: Advancing Analytics Maturity with Google Marketing Platform. This includes pre-sale dates, official publishing dates, and more.

Search InfoTrust

Leave Us A Review

Leave a review and let us know how we’re doing. Only actual clients, please.