Better Conversion Data with Looker Studio

Better Conversion Data with Looker Studio
Estimated Reading Time: 8 minutes

Conversion rates are a simple percentage of “how many people visited my website vs. how many people fulfilled the site’s objective?”

As kids, that might be “how many candies could I steal vs. how many did I steal?” While it’s a very basic concept, calculating it can involve some finesse when referring to web data—especially if you want to find numbers you can examine and make decisions from.

Credit: Lucille Ball, a.k.a. OG Queen

Universal Analytics uses “goal” configurations to achieve this within a property (while Google Analytics 4 (GA4) uses events marked as ‘conversion’ to achieve this within a property). The problem (lack of specificity) here is that you can have several websites inside of a property, and every website has several pages, or domains. This means not everybody got to the candy jar. Some of us were just inside of the kitchen, or inside of the house, or inside of the town. We didn’t all have the opportunity to grab the candies. 

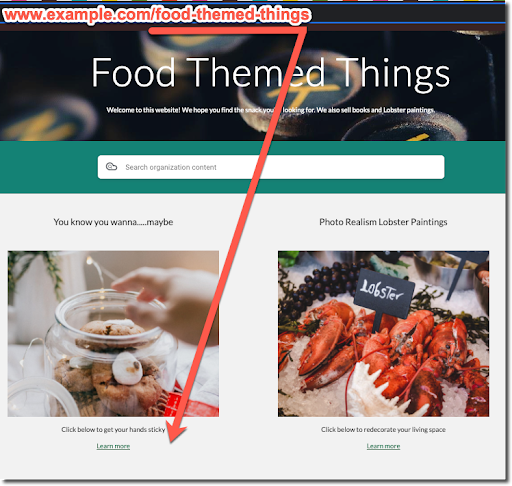
Similarly, not every web visitor lands on the page with your goal conversion on it.

So if you have 1,000 in the town (or, people interested in your websites), 500 people get into the house (or, to your goal-tracking website), 100 people get into the kitchen (or, to a section of your website where goals live), and 50 people could reach the candies (or, see the button you’re using to track your goal), how are you calculating your conversion rate?

Let’s say 10 people fulfilled your objective on a website. 

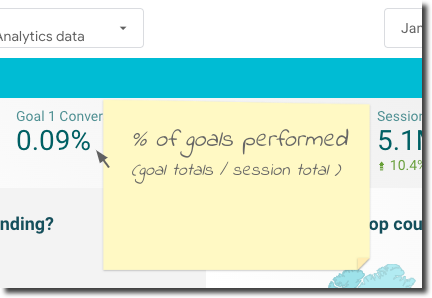
With default Google Analytics (GA) conversion rates, all of the people who visit your website (GA Property) are used to produce your “conversion rate”. This may mean a rate of 10/1,000 (1,000 visitors, 10 who fulfilled your objective) which gives you a conversion rate of 1 percent

But if you can get closer, and find that only 50 people had access to your goal, your conversion rate would be 10/50, which is a 20 percent conversion rate

1,000 may have been to your site (or properties), but only 50 had the chance to convert.

You might also wonder “hey, what if 10 goal-clicks were performed by only four people?” This means there are 50 people who could perform those goals, and four people did. Your conversion rate is then 8 percent—meaning 8 percent of all people with access to ‘candies,’ ate them. Thieves. 

Additionally, what if 1,000,000 people visited your website, 300 people converted. Your conversion rate would be 300/1,000,000, or 0.03 percent. But if 300 people had direct opportunity to convert, and all 300 converted, your conversion rate should be 100 percent.

See where we’re going?

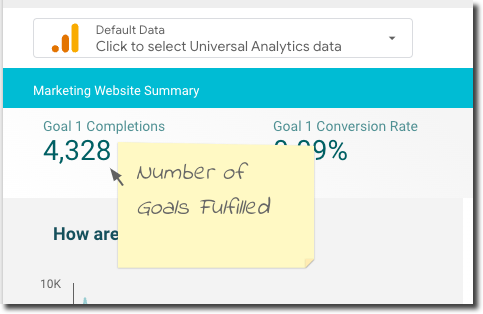
Default Conversion Visualizations Using UA “Goals” and GA4 “Conversions”

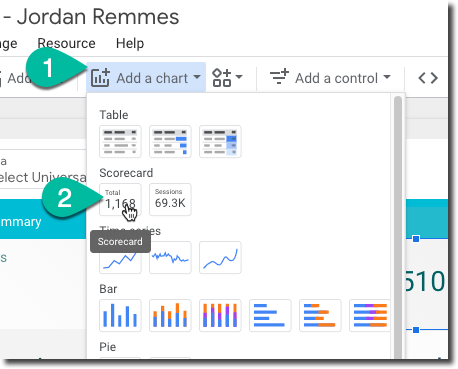
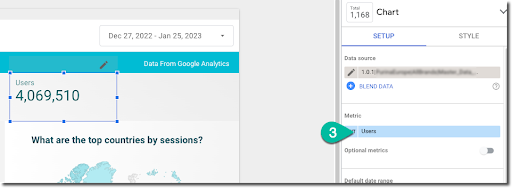
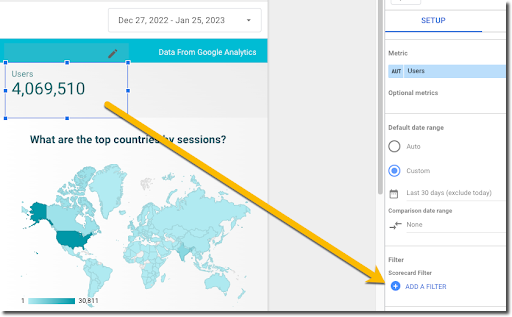
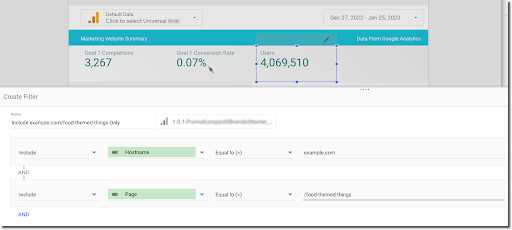
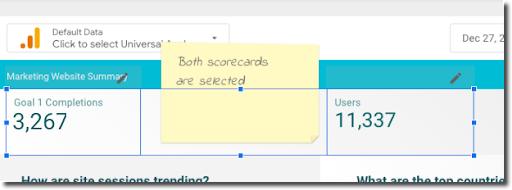
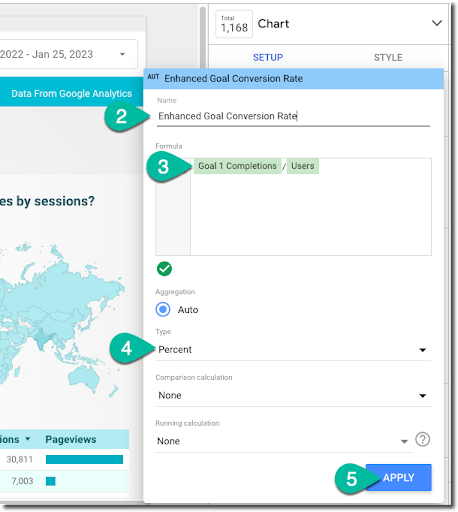
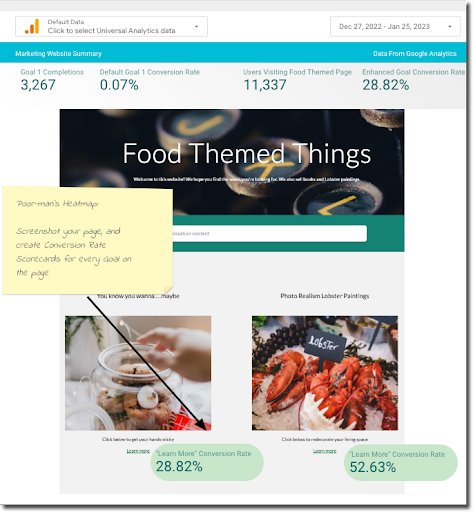
When we take our default conversion data into Looker Studio, you might create a report that looks like this:

Our scorecard metric of 4,328 comes from GA’s default conversion rate dimension for this particular goal. As mentioned, this is a metric calculated by dividing the number of goal completions into the total number of users across all represented within the property and view you have selected. This could mean all users across example.com, example2.org, example3.tv, etc. In this case, we see a very, very small conversion rate of 0.09 percent.

When looking at this strictly in terms of web data, this means we were looking at more than 5,100,000 sessions across all domains within our view. Our 0.09 percent conversion rate is not calculated using the number of people inside of the webpage—it’s counting everyone on the website who may not have had any opportunity to fulfill the goal, and furthermore, you may not have even wanted them all to.

The weakness here is that if your conversion rate jumps by just 0.01 percent in absolute value, you would jump from ~3,000 goal conversions to approximately 373,000 goal conversions. When looking at your conversion rate changing from 0.07 percent to 0.08 percent, you may believe this is a small change, when in fact, it’s relatively significant.

Thus, let’s move onto a much better system of tracking conversion rates using Google’s Looker Studio and a little bit of magic.

Identify Your Webpage Where Goals Can be Found

In this case, we want to know who converted on only example.com (not any other domain) AND also happened to reach the page path /food-themed-things. Our conversion will be when someone clicks on “Learn more” ONLY for the candy topic on the left, and not for the lobster one on the right. (Hungry again?)

Creating Your Enhanced Goal Conversion Rate

You’ll need to start in Looker Studio by creating a scorecard. We’re eventually going to use this scorecard as a blended data source to make the magic we’re looking for. (We’ll perform this in UA, but the same principles apply to GA4, so if you have questions about GA4, hit me up!)

  1. Create your first scorecard with the metric of “Users”.

2. Using this scorecard, create and apply a filter, to include only pages on the domain example.com and only with the page path of /food-themed-things.

With the scorecard selected, click “ADD A FILTER”.

Then, configure your filter:

The Configuration is as follows:

      Name: Include example.com/food-themed-things Only
      Include: >> Hostname >> Equal to (=) >> example.com
      AND
      Include >> Page >> Equal to (=) /food-themed-things

Click “Save”.

Notice how the number of users significantly drops, isolating them to only those who visited the site page specified.

3. Since we already have a scorecard with our number of Goal Completions, there is no need to create one at this point. And so, click your newest, filtered scorecard, hold down Ctrl, if you’re on a PC, or Command, if you’re on a mac, then select your Goal Completion scorecard like so:

Right-click on the two selected scorecards, and select “Blend Data”.

4. A new scorecard will appear. It may or not have the two scorecards within a calculation of fx. Either way, you now need to create a single, blended dimension for the scorecard.

You can see here that Looker took an inaccurate guess at what equation we were looking for:

We simply need to change this fx to the equation we’re looking for, and display it as a percentage.

5. Lastly, rename any of your scorecards (to be as clear as possible) and arrange in any way you’d like. Just look at that beautiful, enhanced metric!

Enhanced, More Meaningful Data

Some options you now have here is that you can “copy” this scorecard, and change it to a chart, a table, or any other visualization you would like, involving the data we’ve just blended. (Note: Looker does not allow you to click your blended scorecard with another scorecard by clicking both and using the method we did above.) 

My favorite use-case is what I call a “poor-man’s heatmap”. 

Using a screenshot of your page and our enhanced conversion rates, we can identify more meaningful information when compared to other goals on the same page. For instance, you may have a 28 percent conversion rate on one “Learn more” button and 52 percent conversion rate on the second “Learn more” button. These percentages are easier to absorb and understand comparatively, than looking at numbers like 0.07 percent vs. maybe 0.075 percent.

Here’s an example of that poor-man’s heatmap with the data we produced:

Remember: Event-based goals are “unique” events—not total events for a user within a session. This means if 50 people got to your webpage and 10 events were performed by four different people, your conversion rate would be 8 percent. Whereas if you use a specific “Event Total” instead of Goal Completion, your conversion rate would be 10 folks out of 50 people, giving you a conversion rate of 20 percent. Make sure your methods are consistent!

Happy analyzing, everybody!

Have questions about Looker Studio?

Our analyst experts are here to help whenever you need us.

Author

Facebook
Twitter
LinkedIn
Email
Originally Published: February 21, 2023

Subscribe To Our Newsletter

February 21, 2023

Other Articles You Will Enjoy

Tracking User Behavior with Events in Google Analytics 4: Examples and Use Cases

Tracking User Behavior with Events in Google Analytics 4: Examples and Use Cases

So you’ve created your Google Analytics 4 (GA4) properties, created your data stream(s), and followed all the necessary steps to configure your property. Now…

5-minute read
Predictive Analytics in Google Analytics 4: How to Use Machine Learning to Forecast User Behavior and Outcomes

Predictive Analytics in Google Analytics 4: How to Use Machine Learning to Forecast User Behavior and Outcomes

Google Analytics 4 (GA4) is embracing the power of machine learning by incorporating predictive analytics within the platform so that you can use your…

7-minute read
Deploying Digital Analytics Changes at Scale for CPG and Multi-Brand Organizations

Deploying Digital Analytics Changes at Scale for CPG and Multi-Brand Organizations

The digital analytics industry is going through seismic shifts, and it is important for CPG organizations to stay abreast of the changes and stay…

5-minute read
What Is Consent Mode in Google Analytics 4 and How Does It Work? | A Beginner’s Guide

What Is Consent Mode in Google Analytics 4 and How Does It Work? | A Beginner’s Guide

Consent Mode in Google Analytics 4 (GA4) is a helpful tool for website owners to respect user privacy preferences when it comes to tracking…

3-minute read
Leveraging Attribution Models in Google Analytics 4 to Improve Your Marketing Strategy: Tips and Best Practices

Leveraging Attribution Models in Google Analytics 4 to Improve Your Marketing Strategy: Tips and Best Practices

In the dynamic landscape of digital marketing, understanding the customer journey is crucial for optimizing strategies and maximizing ROI. Google Analytics 4 (GA4) introduces…

5-minute read
Google Analytics 4 Implementation Checklist: Ensure You’re Tracking Everything You Need

Google Analytics 4 Implementation Checklist: Ensure You’re Tracking Everything You Need

In the dynamic landscape of digital marketing, data is supreme. Understanding user behavior, preferences, and interactions on your website is crucial for making informed…

4-minute read
Leveraging Custom Dimensions and Metrics in Google Analytics 4 for Content Performance Measurement: Best Practices and Real-World Examples

Leveraging Custom Dimensions and Metrics in Google Analytics 4 for Content Performance Measurement: Best Practices and Real-World Examples

In today’s digital landscape where content reigns supreme, understanding how your audience interacts with your content is paramount for success. For news and media…

5-minute read
Advanced Analysis Techniques in Google Analytics 4: How to Use AI-Powered Insights and Predictive Analytics for Effective Marketing

Advanced Analysis Techniques in Google Analytics 4: How to Use AI-Powered Insights and Predictive Analytics for Effective Marketing

AI-powered insights and predictive analytics are revolutionary tools reshaping the modern marketing landscape. These advanced analytics techniques, particularly prominent in Google Analytics 4 (GA4),…

8-minute read
Is It Time to Upgrade? 4 Signs Your Organization Needs Google Analytics 4 360

Is It Time to Upgrade? 4 Signs Your Organization Needs Google Analytics 4 360

As VP of Partnerships at InfoTrust, I’ve had the opportunity to talk with hundreds of decision-makers about their interest in upgrading to Google Analytics…

4-minute read

Get Your Assessment

Thank you! We will be in touch with your results soon.
{{ field.placeholder }}
{{ option.name }}

Talk To Us

Talk To Us

Receive Book Updates

Fill out this form to receive email announcements about Crawl, Walk, Run: Advancing Analytics Maturity with Google Marketing Platform. This includes pre-sale dates, official publishing dates, and more.

Search InfoTrust

Leave Us A Review

Leave a review and let us know how we’re doing. Only actual clients, please.