
It’s not uncommon to look through the list of Google Data Studio chart options and wonder “How would I even use that?” Which translates to “How could this possibly be valuable?” The fact of the matter is, we tend to create dashboards with the tool we already want in mind “Oh, this guy needs a pie chart!” or “a colorful histogram would make my data sing.” So prepare to venture outside the box. Fasten your pencil protectors and have a seat, fellow visual geeks.
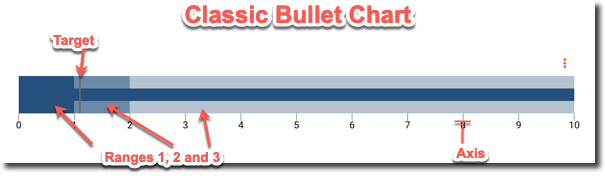
Bullet charts, or bullet graphs, are a pretty simple concept — though its inventor, Stephen Few, might beg to differ. It’s a variation of your standard bar chart, but only using a single metric, and logging a scale as values progress. Much like a thermometer, where the temperature metric rises and falls. Bullet charts also tend to include benchmarking, or color-coded values your metric may strive for (or against). In literal terms, changes in value create a single, visual “bullet” across the X axis.
But with Google Analytics data, we’re more often analyzing several metrics, potentially across several dimensions, relative to other data. In other words, if you want to know the conversion rate of five different Google Analytics Goals, you may opt to use a standard bar chart or histogram to see which goals are performing the highest.
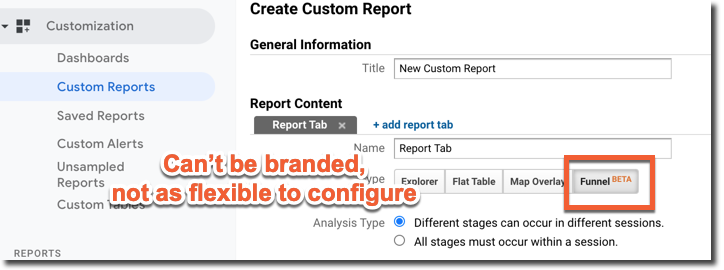
Google Analytics has a new Custom Report Feature, currently in Beta, which allows for Funnel creation but does not allow for the flexibility and granularity of a Data Studio configuration or shiny perfect branding for you nor your client.
With all of this in mind, there are a few sneaky ways you can make bullet charts inside of Google Data Studio, including the semblance of conversion funnels and mock-histograms.
The Bullet Chart Conversion Funnel
Conversions and funnels and paths (oh my). We all know that customer journey’s often take many, many twists and turns. This is why Google Analytics offers reports such as Behavior Flow, and (reminder, still in beta) Conversion Funnel Custom Reports. The latter is the closest approximation to what a bullet chart can get you. It works best when establishing an exclusively linear path for your user journey. For instance, your user’s checkout process of users who visited the Cart Page >> Checkout Page >> Payment Page >> Confirmation Page. You can build these funnels to track users inside of one session, or inside of any session. But a major problem is, we can’t zap these funnels into Google Data Studio.
Another example of conversion funnel behavior is your site may be using a selector tool or wizard. Say you want to analyze how your users find out which cocktail is right for them.
Your wizard steps may include page URLs indicating:
- website.com/my-perfect-cocktail
- website.com/my-perfect-cocktail/chocolate-v-vanilla
- website.com/my-perfect-cocktail/personality-type
- website.com/my-perfect-cocktail/form-or-function
- website.com/my-perfect-cocktail/results
Each page would be sequential. Unique pageview visitors would not be viewing /results if they had not first viewed /chocolate-v-vanilla. Make sense?
We can use Bullet Charts as visual cues to determine which percentage of users traveled from one step to the next. This can help you identify where users may be dropping off, and thereby test methods of improving their completion rates.
Here’s How It’s Done
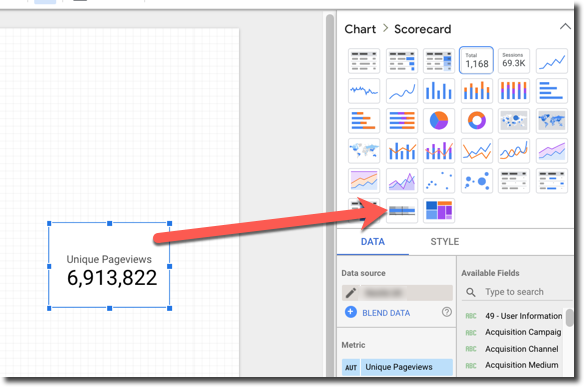
1) Create a Scorecard chart (stay with me, it won’t be a scorecard forever!)
2) Assign Unique Pageviews metric to the scorecard
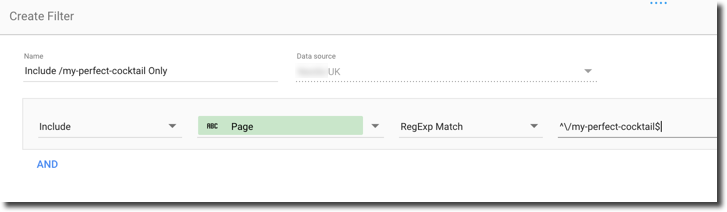
3) Build and apply a Filter of Include >> Page >> equals >> /my-perfect-cocktail
NOTE: be certain you have excluded unnecessary query parameters and also if you have the hostname URI appended to your “page” dimension, use the full page location of “website.com/my-perfect-cocktail”. You can slice and dice with a RegEx as well:
4) Apply this filter to your scorecard
5) Click your scorecard, copy & paste
6) Click the pasted scorecard, go to the right of your dashboard, and click “bullet chart” (this will convert your selected scorecard automatically — magic!)

7) Reselect your scorecard, and to the right under scorecard properties, select Style
8) Click Hide Metric Name
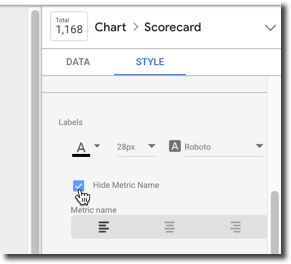
9) Gaze at that beautiful integer

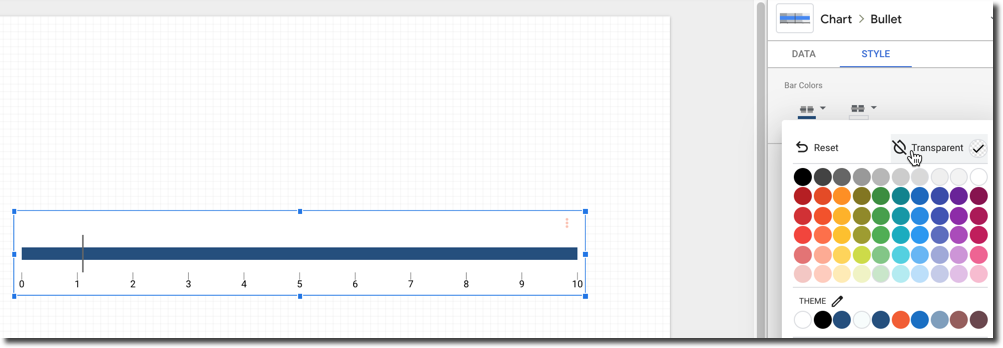
10) Reselect your Bullet Chart
11) Under Style, select the Range Color, then select “Transparent”
12) Also under the Style tab, uncheck “Show Axis”
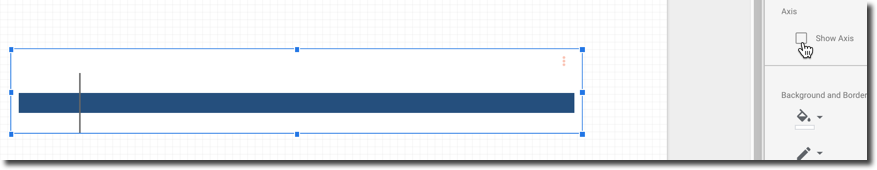
13) Head back to your Data tab and uncheck “Show Target”
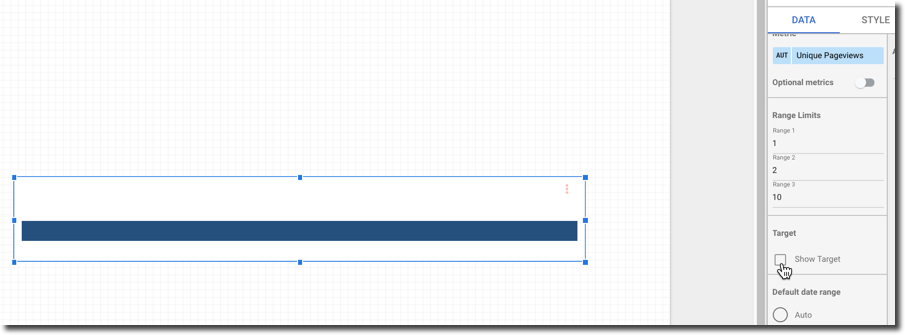
14) Look just above this and find Range 3. Change this range to be significantly higher than the Unique Pageviews you’re working with, and remember this number.
In this case, we’ll choose 10,000,000

15) Give yourself a pat on the back, and admire creating the first bar of your Histogram and first funnel step for your visitors on /my-perfect-cocktail
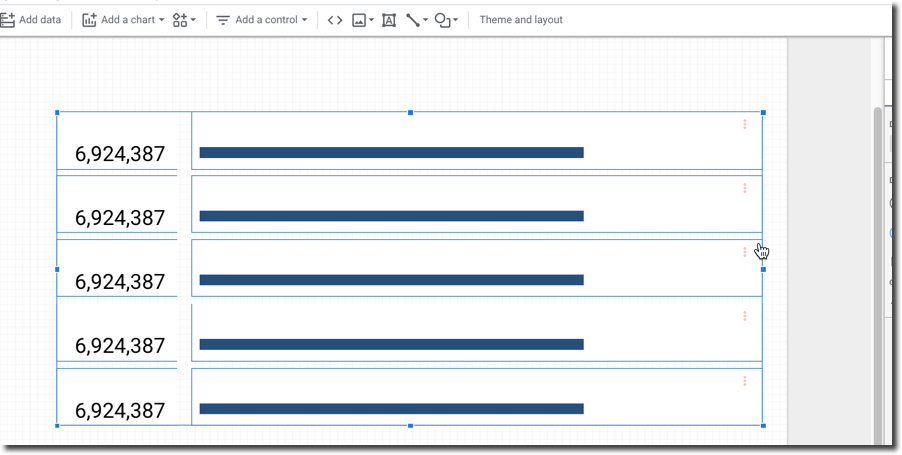
From here, it is a matter of replicating the above steps, but with the appropriate page filter for each. Just be sure to copy and paste both the scorecard and the bullet chart (prior to removing and applying the proper page filter) so that your formatting is maintained. This will make life easier for you 🙂
16) Replication will eventually look something like this
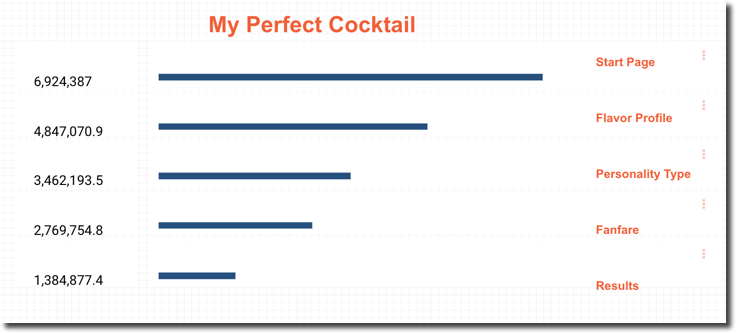
17) Once your page filters are configured and applied, you may leave your data as a mock-histogram we mentioned earlier like this:
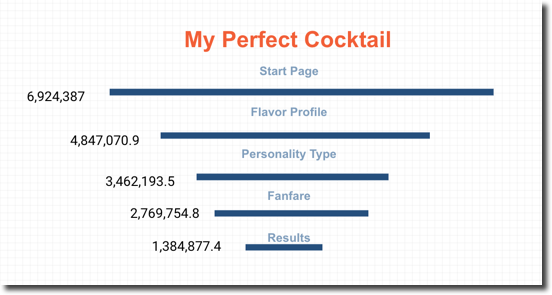
18) Or if you’re more of a funnel purest, you may shift your workaround for something with a little more zazzle
19) You may even opt to spice things up further by adding filter options for your viewers. For instance, if you’d like to see how different traffic sources go through your funnel, simply add a source/medium to your dash, and you’re off and running

20) Et, voila!
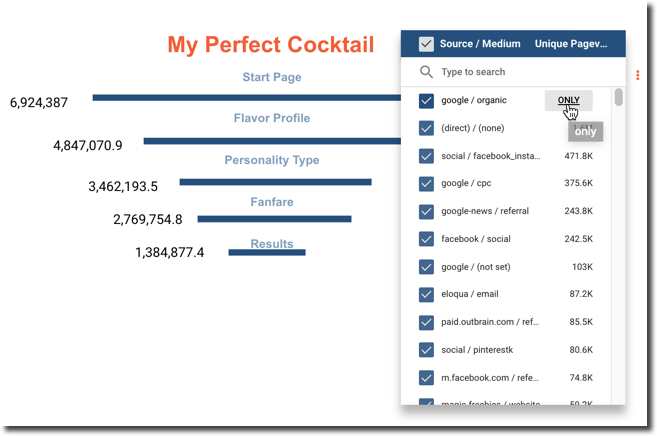
What can you do with this data? Say, for instance, your Email traffic has a high completion rate, but your Organic traffic could use a boost. Simply segment this audience in Google Analytics and remarket to increase conversions. This is just one of the countless ideas for you and your data!
Remember, this works on historical data, and no goal configuration is required 🙂
Happy analyzing, everybody!