

Want to better understand which content on your site grabs eyeballs, keeps eyeballs, and gets those eyeballs to open their wallets?
It’s a common problem: Your site has hundreds of pages of high quality content, but how successful is it? How can you tell which pages drew users in and which were duds? Of course, you can check the All Pages report in Google Analytics for page views, bounce rate, etc., but this is page-level data. With the exception of really popular pages, such as the home page and key landing pages, page-level performance metrics for single pages are too granular. Instead, it would be more insightful and actionable to understand how each distinct section of the site performs, especially compared to the others.
GA’s content grouping is the solution you’ve been waiting for, allowing you to aggregate your data to better understand engagement, navigation, and ultimately conversions.
How To Use Content Groupings
Suppose I launch an e-commerce site called Pam’s Pets. My site sells food and accessories for dogs and cats and has a blog. Looking at the All Pages report, I can see that the ‘Small Dog Bumblebee Costume’ page is a clear winner – it has a high number of page views, a low exit rate, and a higher than average time on page. But what about the other dog outfits; does this whole section of the site perform well? At an even higher level, how about the dog pages vs. the cat pages? Which of those categories is more popular and engaging to my audience?

With content grouping, you can create up to 5 different ways to aggregate the site’s content. Within each of these 5 content groupings, you can create as many groups as you need. For example, the first content grouping will be a high-level aggregation that categorizes all pages into one of five groups: Home, Dogs, Cats, Blog, and Checkout. I’ll call this first content grouping the Page Category.
You have two options for structuring the remaining content groupings: You can take a nested approach that mimics your site’s breadcrumb or you can create independent, unrelated content groupings. I like to use a combination these two approaches and I’ll show examples of both.
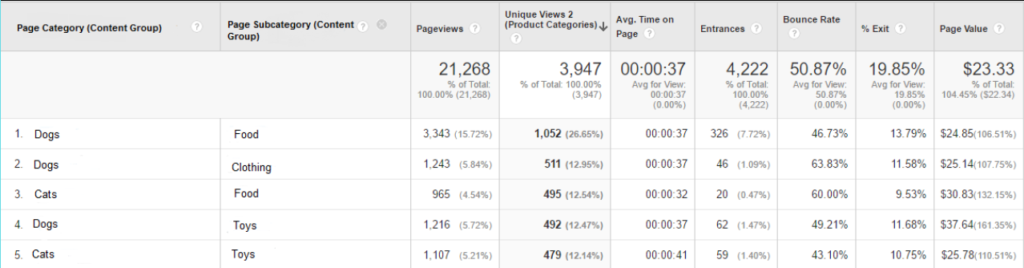
The second content grouping, called Page Subcategory, will have a nested structure that reflects the site’s breadcrumb. Within each of the 5 page categories, Page Subcategory provides an additional layer of detail about the pages in each Category. For example, the Dog pages are grouped into these subcategories: Collars, Leashes, Food, Clothing, Toys, and Beds. The Cat pages have some similar, and some different, subcategories: Collars, Food, Toys, Beds, and Kitty Litter. Note that there doesn’t need to be any overlap in the subcategories for Cats and Dogs; you can create as many content groups as you’d like. With the nested structure, it makes sense to view the Page Category and Page Subcategory together in a single report.
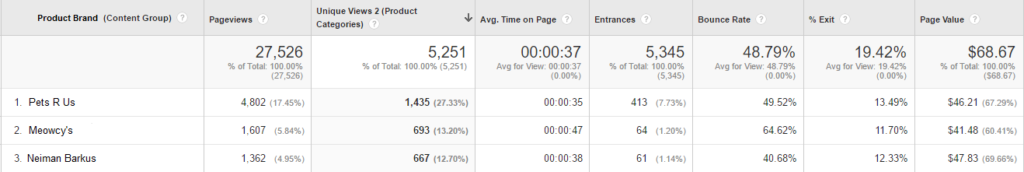
For the third content grouping, we’ll create a new aggregation that is unrelated to Page Category and Page Subcategory. This grouping will be based on the Brand of products sold on the site. With this grouping, we can understand the success of individual brands across the different categories and subcategories.
How To Analyze Your Data with Content Groups
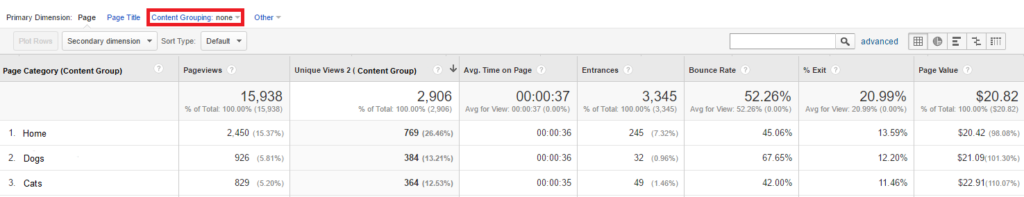
In the All Pages report, you can change the primary dimension to any of the content groupings. Here you can see aggregated engagement metrics – such as page views, average time on page, and bounce rate – for the pages in each content group. Although the two sections have a similar number of page views, the Cat pages have an overall lower bounce rate and higher page value compared to the Dog pages. Although the Dogs and Cats pages are equally popular, the Cat pages are more engaging to users.
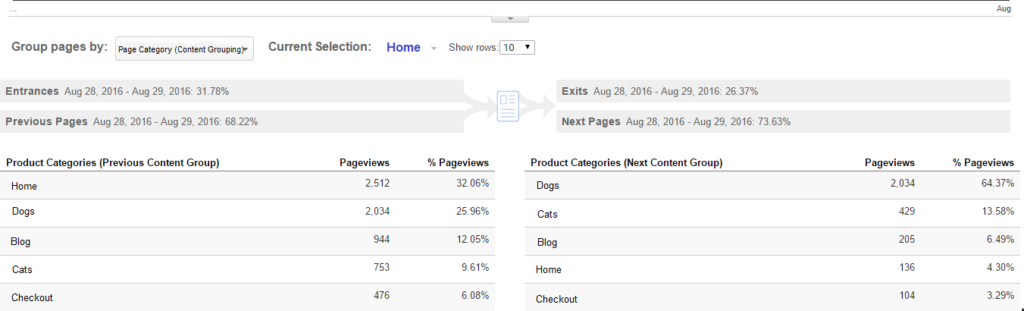
We can use the Navigation Summary within the All Pages report to understand user navigation throughout the site. This report shows two key pieces of information: For each content group, the table on the left shows the previous content group and the table on the right shows the next content group. That is, for each content group, we can see where the user came from and where they navigated next.
For example, for the Home page, about 32% of views of this page were entrances; of those that weren’t entrances, 32% came from the Home page. From the Home page, about 26% of sessions exited the site; of the remaining 74% that didn’t exit, the majority (64%) navigated to the Dog pages. We learned from this report that the Home page is good at drawing users in (there are fewer exits than entrances) and that the most popular path from the Home page is to the Dog pages.
You can also view the Landing Pages report by content groups so that you can learn more about sessions that begin in different sections. After the Home page, users most often enter the site on the Blog pages (specifically Dog articles). However, these sessions have a lower e-commerce conversion rate (1.07%) than the site average (1.60%). We can also see that the Dogs – Outfits section of the site performs well as a whole, with sessions beginning on these pages having nearly double the average conversion rate. The ‘Small Dog Bumbleebee Costume’ isn’t a fluke!
Finally, what about the performance of branded products across different sections of the site? The biggest brand on the site, Pets R Us, sells both Dog and Cat products and these pages drive 17% of all page views. Meowcy’s, a smaller brand, only sells cat toys but is the second most popular brand in terms of page views. To dive in deeper, I created segments for these pages and viewed the All Pages report to find the total number of pages in each content group. Turns out there are only 7 Meowcy’s pages and 70 Pets R Us pages. Pets R Us pages drive 3x as many page views but have 10x as many pages. On average, the Meowcy’s pages are more popular than the Pets R Us pages!
How To Set Up Content Groupings
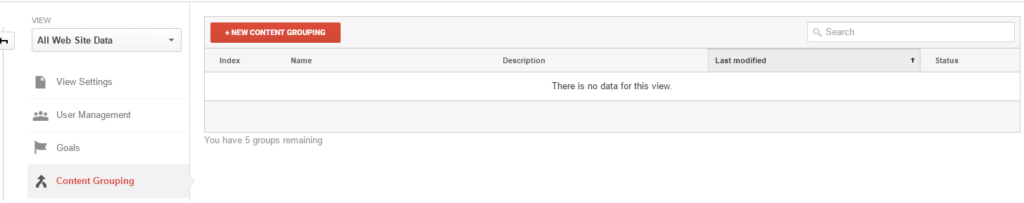
There are three ways that you can set up content groupings in your GA account: Via the tracking code on your site, URL or page title/screen name extraction, or the rules editor. You can use a single approach or any combination of the three; if you’re using more than one, the rules are applied sequentially (that is, tracking code is evaluated first, then extraction, and then rules). You configure the content groupings on the Admin screen under the View Settings.
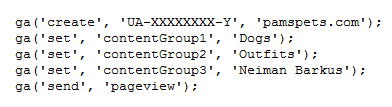
- I recommend using the tracking code method. To use this approach, the development team updates the analytics code in the page source to include the content groups. If you aren’t using a tag management system (TMS), the updated code will look like this:
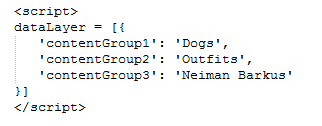
If you are using a TMS like Google Tag Manager that reads out of a dataLayer object on the page, you can add the content groups directly to the dataLayer. Then you’d configure the pageview tag in the TMS to map the dataLayer variables to the content groupings. The dataLayer object with the content groups will look like this:
This approach is preferred because it’s more sustainable and less error-prone than the other two methods; however, it requires development resources and is not an immediate solution.
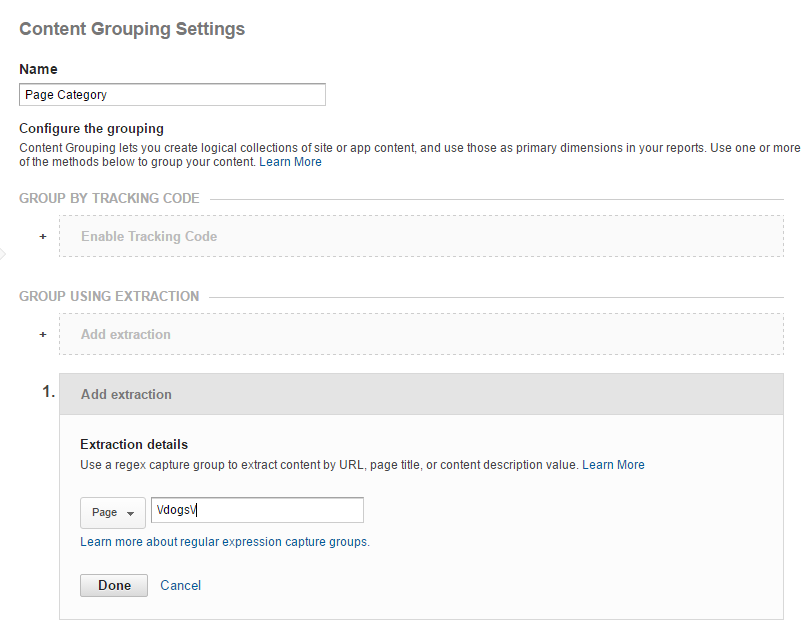
- If the page titles or URLs reflect how the site’s content is organized, you may opt for the extraction method. The extraction method allows you to create content groups by using regular expressions to match the page URL, page title, or screen name. For example, the URLs for all of the Dog pages contain the string “/dogs/”. To create the content group, I’ll use the regular expression “\/dogs\/” to capture all of the URLs that include the “/dogs/” string . Similarly, if the page titles for all of the Dog pages include “Dogs”, I could create a regular expression to group all pages whose title includes the string “Dogs”.
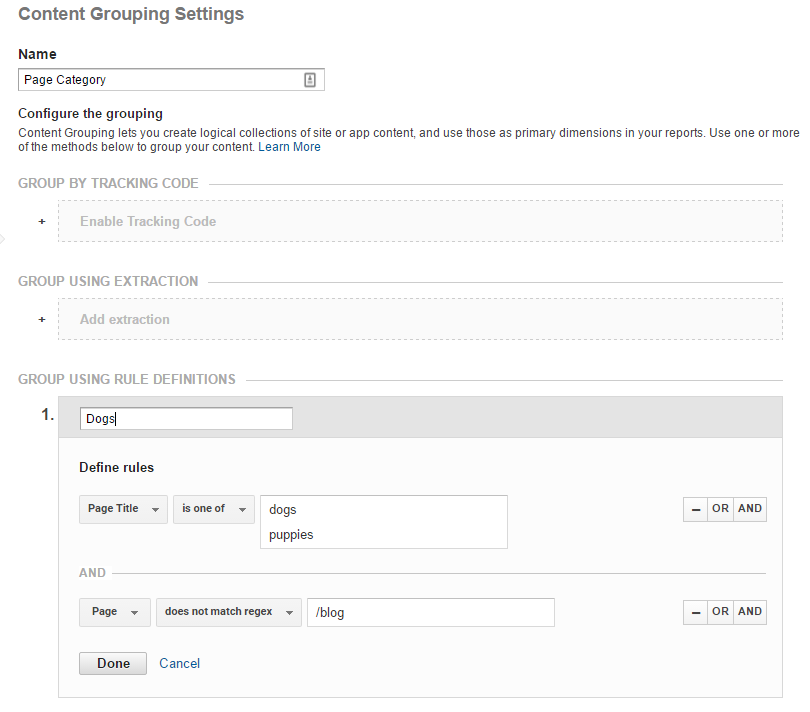
- Using the rules editor is similar to the extraction method but allows for greater flexibility. Like the extraction method, you create the content groups based on patterns in the URLs, page titles or screen names. However, several more logical operators are available, such as ‘is one of’, ‘does not exactly match’ and ‘does not match regex.’ You can also add several conditional statements into a single rule. For example, if the Dogs content group is based on the page title containing “Dogs” or “Puppies”, I can exclude URLs that contain “/blog” since these pages belong in the Blog group .
Best Practices for Creating Content Groupings
- Choose a method that is sustainable for your site. If the page titles or URLs do not readily reflect the aggregation that you want to create via content grouping, select the tracking code approach.
- For any method, double-check how the content groups are assigned. You can make changes to the content groups going forward but you cannot make changes to historical data.
- If you’re using the extraction or rules methods, order them from most specific to most general as they are evaluated sequentially.
- Review the data occasionally to ensure that new pages are properly categorized (especially if you’re using rules). Look for content groups that are “(not set)”, indicating that the page did not meet any of the configured rules. You could also create a report to view the pages within each content group by including page and content group as dimensions.
- Ensure all content groups are set on all pages. Assigning all content groups on every page can help you identify pages that are not being categorized based on the existing rules. For example, there are many pages that do not have a Product Brand, such as the Account pages or FAQs. Even simply labeling these pages as ‘Unbranded’ is more descriptive than “(not set)”, which could indicate an error.
How have you used content grouping to uncover insights? Share your comments below!
References
Analytics Help: https://support.google.com/analytics/answer/2853423?hl=en
Justin Cutroni’s Blog Post: http://cutroni.com/blog/2014/01/09/set-google-analytics-content-grouping/