Data Studio 360 is Google’s new data visualization tool that was announced as part of the Google Analytics 360 suite of products. It has many benefits, especially if you’re already in the Google ecosystem with Google Drive, Google Analytics, AdWords, YouTube, etc.
I’ve covered the features and benefits of Data Studio 360 in a previous blog post, but today I wanted to share what’s possible with Data Studio 360 using data outside of the automatic integrations between other Google products.
I wanted to take a look at data around a timely event, the 2016 US presidential race. Hours of unsuccessful searching for public data sets around the election led me back to Google Trends, which breaks down and compares search term interest over time. It’s a pretty good indication of public interest in specific topics.
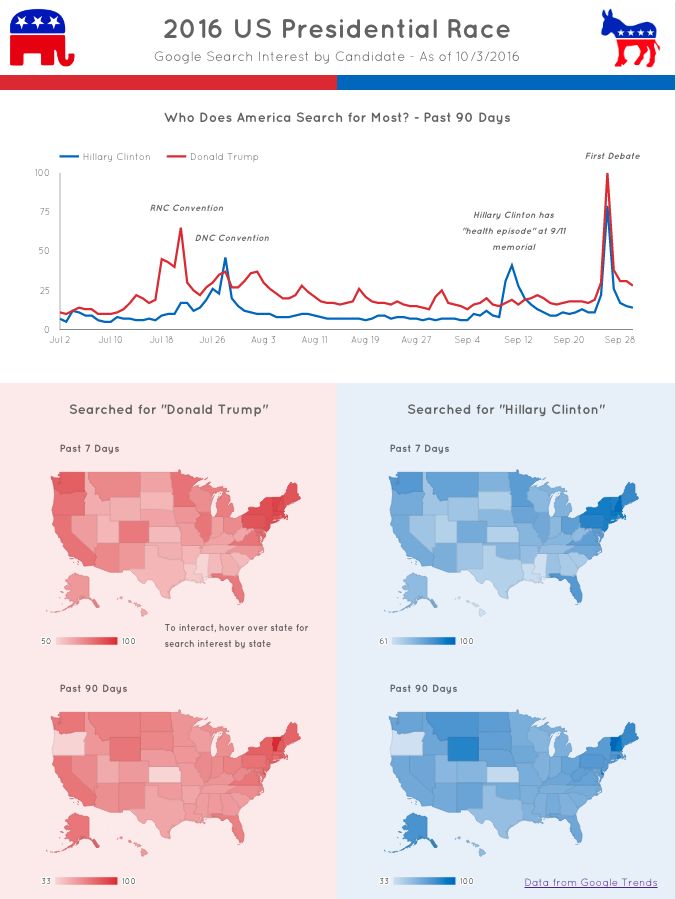
My interest in this data was which presidential candidate was being searched most over time and by state. The data sets were fairly simple, but they illuminated some interesting data points.
A few questions I asked myself before I created this visualization:
- Which candidate gets searched for the most?
- Which states are searching most for each candidate? And has it changed over time?
- Do specific election events correlate with spikes in a candidate’s Google search interest?

Link to interactive dashboard (must be signed in to Google account)
Currently, with Data Studio 360 still in beta, there are some limitations to the product. Embedding the product into a web page or app is not a feature currently supported. However, you can follow this link to view the interactive dashboard.
Also, the key ranges for the geomaps can’t be manually set (currently), so I couldn’t keep the lower limit on the key the same over the four charts. This would be very beneficial for comparisons, Google!
A few things you can see from the interactive dashboard:
- Over time, Donald Trump is being searched for more often than Hillary Clinton
- Spikes in search interest over time do correlate with specific election-related events like the national conventions and first presidential debate
- The Northeast’s interest in both presidential candidates increased over the past seven day
People are continuing to find new uses for Data Studio, which is exciting, so I look forward to seeing how the Data Studio community extends the tool.
We’ll have some exciting news regarding our company and Data Studio in the next few weeks, so stay tuned!

