
I came across an article a while back: Seeing the Face of God in a Microchip Factory, which is a brilliant, fascinating read; here’s an excerpt that started the train of thought that led to me writing this blog:
“The Sacred Mountain is reckoned to protect the whole island of Taiwan—and even, by the supremely pious, to protect democracy itself, the sprawling experiment in governance that has held moral and actual sway over the would-be free world for the better part of a century. The mountain is in fact an industrial park in Hsinchu, a coastal city southwest of Taipei. Its shrine bears an unassuming name: the Taiwan Semiconductor Manufacturing Company.
By revenue, TSMC is the largest semiconductor company in the world. In 2020, it quietly joined the world’s 10 most valuable companies. It’s now bigger than Meta and Exxon. The company also has the world’s biggest logic chip manufacturing capacity and produces, by one analysis, a staggering 92 percent of the world’s most avant-garde chips—the ones inside the nuclear weapons, planes, submarines, and hypersonic missiles on which the international balance of hard power is predicated.”
A company I’d never heard of was the number one—nearly the only—manufacturer in the world with a near-total stranglehold of the production of a thing that’s in everything these days.
More recently, I came across this quote on Twitter (no I’m not calling it X): “It is wild how if you dig into the supply chain for any slightly unusual but still very important product, there’s like a 50% chance of massive portions of it resting entirely on one company or even one guy, often one on the brink of disappearing for some reason.”
One of the replies asked for an example, and the author of the tweet gave the example of Chalk River Laboratories’ production of medical isotopes, which I knew nothing about, so I did some digging on the subject and found: Supply capacity is always substantially (e.g. 50%) above demand. The world’s supply comes from just six reactors, five of which are more than 50 years old. In 15 years, 75 percent of the reactors will need to be replaced. The market for these isotopes is estimated at around $5 billion per year, according to NECSA.
First-Order Problems
The vast majority of people, myself included, generally don’t understand their supply chain beyond the first order. When COVID-19 shut down most of the world, everyone from CEOs to consumers realized how little they knew about supply chains and how fragile they were. More recently, the invasion of Ukraine hammered the point home, this time on energy when supplies of natural gas dwindled. The situation was exacerbated in the UK when the government closed storage facilities, assuming that the market would compensate for any potential shortages. However, they didn’t consider that other countries would also be in the market, and that prices fluctuated based on demand. Thus, if there is a shortage of gas and limited availability, the cost would be higher than if it had been purchased and stored beforehand. The UK currently has the highest energy prices in Europe owing to this, and other government profligacy.
The Houthi blockade of the Red Sea from Yemen, much like the one in the Suez canal in 2021—at least as far as effect goes, in response to the ongoing genocide in Gaza, has meant goods transported on ships from/flying flags of a country not opposing the genocide have to sail all the way around the African continent instead. This means things take longer to get to where they’re going and the journey costs more to make, all of which is reflected in the final price to consumers. With so many examples of what not understanding supply chains can cause, you’ve got to ask yourself what’s being done about it? For many countries, there’s a lot of talk and very little action—but that’s not the case for everyone.
The Moonshot as Government Policy
The State Council Information Office of the People’s Republic of China published a white paper titled “China and the World in the New Era” in which it claims: “China is the only country that possesses all the sections in the United Nations’ International Standard Industrial Classification of All Economic Activities (ISIC), with the output of many industrial products ranking first in the world.”
There are endless opinions, expert or otherwise, on how this is unrealistic and unachievable, but “China wants America’s Silicon Valley, but regulated; Japan’s car companies, but electrified; Germany’s Mittelstand, but scalable; and Korea’s chaebol conglomerates, but without political capture. It wants to lead the world in science and technology, but without cram schools. A thriving economy, but with common prosperity. Industry, without air pollution. Digital lifestyle, without gaming addiction. Material plenty, without hedonism. Modernity, without its ills. This is, of course, a wish-list and unrealistically ambitious. But these mad scientists sure as hell are going to try. They’ve developed a taste for it.”
It’s estimated that 45 percent of China’s manufacturing output is exported. But we’ve long since passed the era of cheap toys and clothes. China is now competing in every arena, cutting into markets that competing countries have historically held. There is no precedent, that I’m aware of, for a country to be a major player in the World Economy and have a complete domestic industrial supply chain at the cutting edge of technological and industrial development. How does your country compare, how does any compare to that scale of ambition?
Digital Data Supply Chains
Focusing on something more familiar, many of the challenges faced in business are conceptual; How can I make sense of this problem? How can I best meet customer needs? Deliver on business objectives? What solution is possible within this budget and timeline? The primary role of digital analytics is to enable decision making, and to do so requires knowing:
- What decisions you need to make
- Why, as in the intended outcomes of the decisions
- What you need to know to make those decisions
To answer these questions, you need to understand your customer needs, what’s required to meet them, and the related people, process, and technology involved. Just like a physical supply chain moves goods from farms to factories to storefronts, the data supply chain does the same with information via technology, tools, and related processes. From generation at source through to collection, processing, storage, analysis via visualization or maybe modeling, all to enable a decision to be made.
Enter the Wardley Map
Below is a much-used example of a Wardley Map for a tea shop:
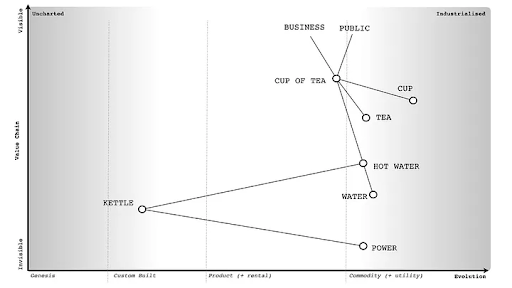
The customer (public) is the anchor. Their need is a cup of tea. Everything else is what the business needs to deliver the customer’s needs. This makes up the value chain. Things lower down on the vertical axis are less visible to the customer. The horizontal axis describes the current state of evolution of a component. Here you can see that this company is custom-building kettles. Discovering your company is custom-making kettles when there are off-the-shelf products available would make some difference to your bottom line. And while this may seem simple to the point of being laughable, I’ve come across numerous examples of similar mishaps, including a company building their own app only to mothball when the costs of maintaining and improving it are realized years on from the start of the project and an off-the-shelf solution that another department was already using brought in instead and a six-figure sum down the drain.
These kinds of discoveries are easier to make using a Wardley Map as a vehicle to combine and visualize what would be considered intimate knowledge of a company’s processes, which is spread across the business and often lacking at the executive level where decisions are made. Once a company has mapped its components required to deliver customer needs, they can begin discussing and deciding on what they need to measure, as well as where and how to measure it to improve on operations linked to a business objective, in greater detail than could be done in using:
- Flowcharts, which are great for depicting the technical flow, but they don’t consider the evolution or value contribution of components
- Process maps, which might capture activities, but they don’t highlight strategic decision points or evolutionary paths
- Some combination of the two, usually found as the output of a measurement framework workshop
Here’s an example of a map for a fictional online retailer I mocked up that shows the flow of data through their tech stack:
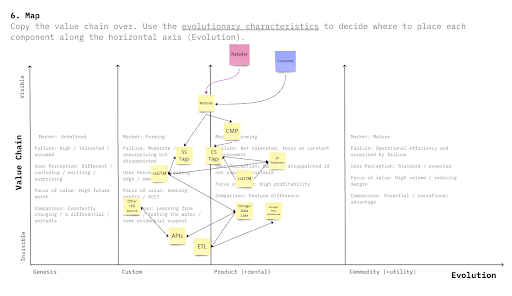
What questions would you ask about the map? Why isn’t third-party platform data connected to the data lake and data warehouse? Why is all the integration work using APIs custom? Do the platforms and/or data sets support a more standardized approach? What’s being done with the data once it gets to the data warehouse? Why isn’t CRM data in the picture? With the right people in the room, you can get answers to those questions and begin to play what-if games:
- Value Chain Analysis: Visualizing the flow of data across the organization can help identify where you can enhance or enable core business activities
- Spotting Opportunities: Identify areas in the technology landscape that are evolving or undergoing a shift, allowing for proactive decision-making
- Stakeholder Alignment: Visualizing your digital data supply chain means discussions with your colleagues become more tangible, aiding alignment, and prioritizing efforts
- Resource Allocation: Ensure resources are used effectively by focusing on where investment can have the most impact
- Risk Management: Identifying over-reliance on certain technologies, systems, or vendors can help to create a more resilient supply chain
To end, I’ll start with a quote from W.E. Deming: “It is wrong to suppose that if you can’t measure it, you can’t manage it—a costly myth.” Deming believed in the value of using data to help improve the management of the organization, but he also knew that just measuring things and looking at data wasn’t enough:
- There are many things that cannot be measured and still must be managed
- There are many things that cannot be measured, and managers must still make decisions about
The key is not what is or isn’t measured but managing those things. This requires making decisions. Decision-making is difficult enough without understanding the complete picture, and a Wardley Map is a way to do that. If you’re interested in understanding your digital data supply chain and making better decisions, then you should take a look at our Digital Strategy & Advisory service.