
Marketers are increasingly using machine learning to predict user behavior. This blog post provides a quick guide as to why precision and recall are important metrics for marketers when dealing with a classification problem.
What is a classification problem?
For marketers, some of the most common goals are: identifying high-value customers, finding lookalike (prospects) customers, providing relevant content, and building an overall positive customer experience. In data science, classification modeling is a great approach for identifying key customers. Classification modeling can help answer the question of whether customers fit in one group or another, which is great for segmenting and audience building. Examples of classification problems include:
- Which of my customers will purchase product A?
- Which of my customers will subscribe to my service?
- Which of my customers are likely to churn?
The Case with Imbalanced Data
It is common that in many of the classification datasets, which both marketers and data scientists will deal with, that there will be an imbalanced distribution of classes. Let’s take the classification problem of identifying which of your customers will purchase a specific product. The classes here are purchase or not purchase. An example of a class imbalance is that most of the transactions will be no purchase and therefore purchase is the minority class.
In this case, a classification model will have a low prediction accuracy towards the minority class – purchase due to the fact that it assumes that there is a balance between classes. This is problematic because the minority class is the most important class here a model could achieve high accuracy by predicting that none of your customers will purchase the product. For example, if 5% of customers are in the purchase class and the remaining 95% are in the no purchase class then the model can achieve 95% accuracy by predicting that all customers are in the no purchase class.
Solution
There are many steps involved in tackling a classification problem in an imbalanced dataset as well as evaluation metrics and techniques to deal with imbalanced data. Whilst resampling techniques are commonly used for modeling imbalanced data, in this post I’ll be focusing on 3 key diagnostic measures to evaluate the predictions from an imbalanced dataset and their importance. I’ll use the example of identifying customers that will purchase a product.
Confusion Matrix
A good starting point for classification model evaluation is using the confusion matrix which provides an overview of how accurately the model predicted the customers who had and had not purchased based on the training/test split data. Splitting your data set into training and test datasets helps in the implementation and evaluation of the predictive model. The training data is used to build the model and the prediction results are evaluated on the test data. Below is a summary of the possible output from the model.
For the purpose of understanding this, I’ve made the following definitions:
- “Product purchased” is a positive class.
- “No product purchased” is a negative class.
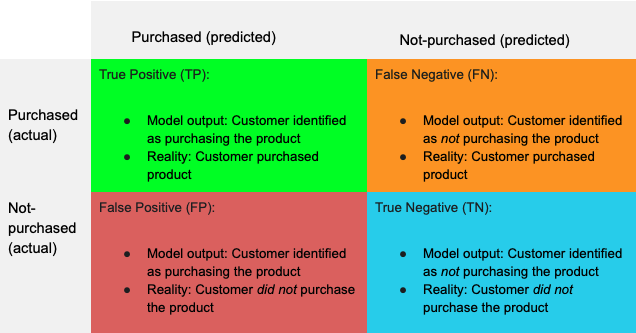
The confusion matrix summarizes how accurately the model had predicted customers who had and had not purchased the product. For example, it can show how many people it had correctly (TP) and incorrectly (FN) classified as making an actual purchase. You will need to decide a threshold value that you will use to evaluate the results on the confusion matrix based on your business problem. You can define the threshold by finding the right balance of the tradeoff of either too many false positives or too many false negatives.
Diagnostic Metrics
There are various ways to evaluate the output of your model, however, for the purpose of this classification example we will be focusing on the following diagnostic metrics:
- Accuracy is generally calculated as: (TP + TN) / (TP + TN + FP + FN)
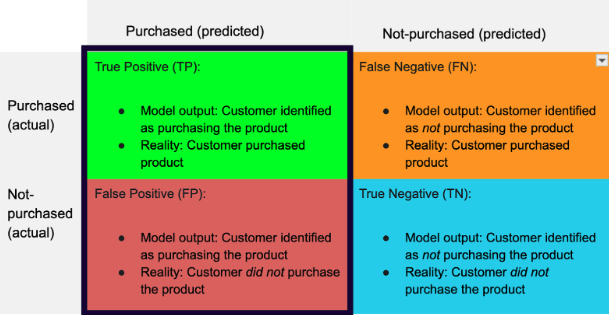
- Precision is generally calculated as: (TP) / (TP + FP)
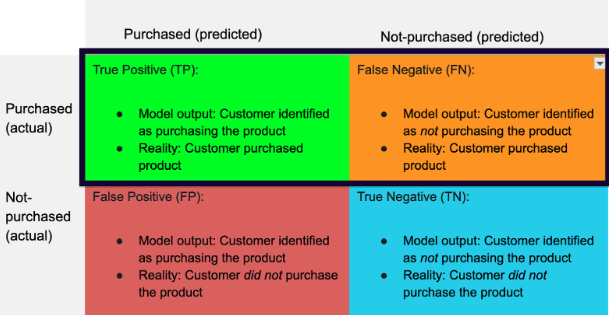
- Recall is generally calculated as: (TP) / (TP + FN)
Model Evaluation
Let’s review the diagnostic metrics as they relate to the example of identifying customers who purchased the product.
Accuracy – Percentage of customers the model has correctly identified as customers that did and did not purchase the product
Precision – Of all the customers that the model predicts will purchase the product, the percentage of customers that actually purchased the product
Recall – Percentage of customers the model successfully identifies that purchased the product
As you can see, using accuracy alone is not valuable for solving classification problems. When the accuracy is great, let’s say 96% accuracy, it can mislead a marketer to think that the model is great when in actuality the model had correctly identified a large percentage of customers that did not purchase the product and few that will. This is not useful as we are looking to identify the portion of customers that actually purchased the product.
When the dataset is imbalanced, the number of negative classes (i.e. number of customers that have not purchased the product) is very large. Using precisions and recall is helpful here as you need to know how many customers the model correctly predicted to purchase the product. It is important to note that these metrics don’t consider true negatives in the evaluation.
Precision has more of a focus on the positive class. This metric is important when you are looking at minimizing the number of false positives. An example here would be when you are using the model to create an audience for a programmatic retargeting campaign. If you want high ROI for your campaign, you would want to minimize the number of people the model incorrectly classes as people who will purchase the product (false positives) and maximize the number of people the model correctly predicts to purchase the product. In this case, precision is a more appropriate evaluation metric.
Recall is important when you are looking at minimizing the number of false negatives. For example, let’s assume you are using the model to select customers for an email campaign. You would want to maximize the number of customers the model correctly predicts to purchase the product and you would want to only target customers who will be interested in purchasing the product. In this case, recall is a more appropriate evaluation metric.
Summary
It is important to note that precision and recall have an inverse relationship. You could have a perfect recall but have a bad precision, and vice versa. As a result, there will always be a tradeoff between precision and recall. There are still other evaluation metrics to consider when evaluating a classification model such as thresholding and area under the curve (AUC). However, I hope this post provides a high-level overview of the importance of understanding the optimum ratio of both metrics and helps you to prioritize metrics depending on your campaign objective and the costs of false positives vs. false negatives.
Want to learn more about precision and recall?
Click below to connect with one of our experts today.
Click Here