What Is Firebase?
Firebase is Google’s Backend-as-a-Service (Baas) solution for mobile app development. Originally it was developed and launched in 2011 by Firebase Inc., and later was acquired by Google in 2014. It started off as a realtime database; however, now it offers developers and marketers a comprehensive selection of tools and products to not only help develop advanced applications but also to market them. The Firebase platform allows for easy integration with IOS, Android, Web, and Unity products. There is a lot to learn about the platform; however, in this article we will cover Firebase Analytics.
What Is Google Analytics for Firebase?
Google Analytics for Firebase is a free, unlimited reporting solution that lets you track up to 500 distinct events. Depending on your needs, you may decide to use the out-of-box tracking, or using the SDK you can log your own custom events. Using the Analytics section you are able to track your users’ behavior; these results allow you to make important decisions about app optimization and product marketing. Google Analytics for Firebase allows you to keep track of what your users are doing in the app as well as keeping track of the campaigns that brought them to the app in the first place (Behaviour and Attribution reporting). Google provides documentation on how to both set up the Analytics SDK, as well as how to log custom events. In this article we shall explore the different parts of the Analytics section.
Dashboard
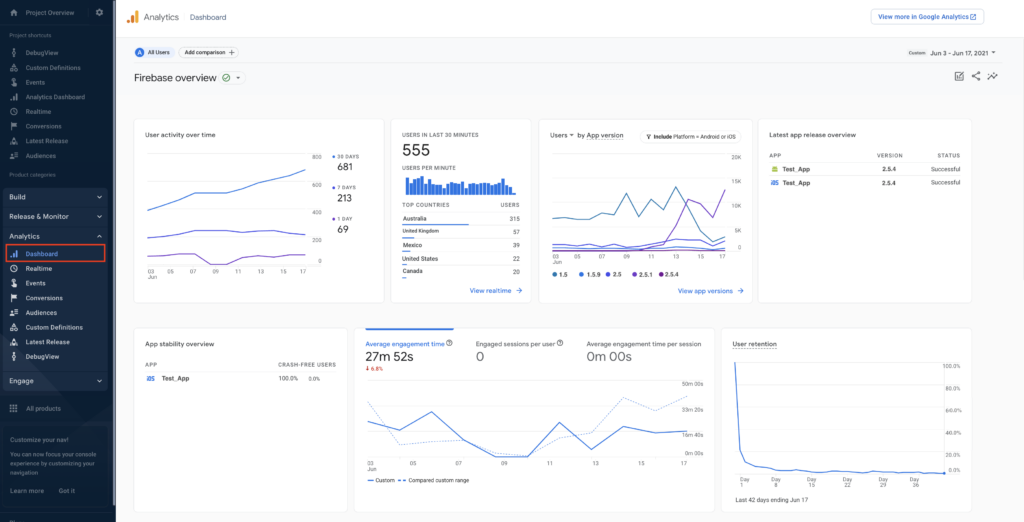
The Dashboard section gives you an overview of various analytical metrics being tracked. These different widgets each provide an insight into user behavior, app optimization, marketing campaigns, and ecommerce data. This section allows you to quickly track users by country, device model, and even lets you track user activity by cohort. Using this section you can also quickly track your top pages, events, and conversion with a custom date. For custom reporting, I suggest using the button in the top-right corner and switching to Google Analytics to make use of the Explore feature. My colleague Jared Fisher wrote a great article outlining the different aspects of the Explore feature.
Realtime
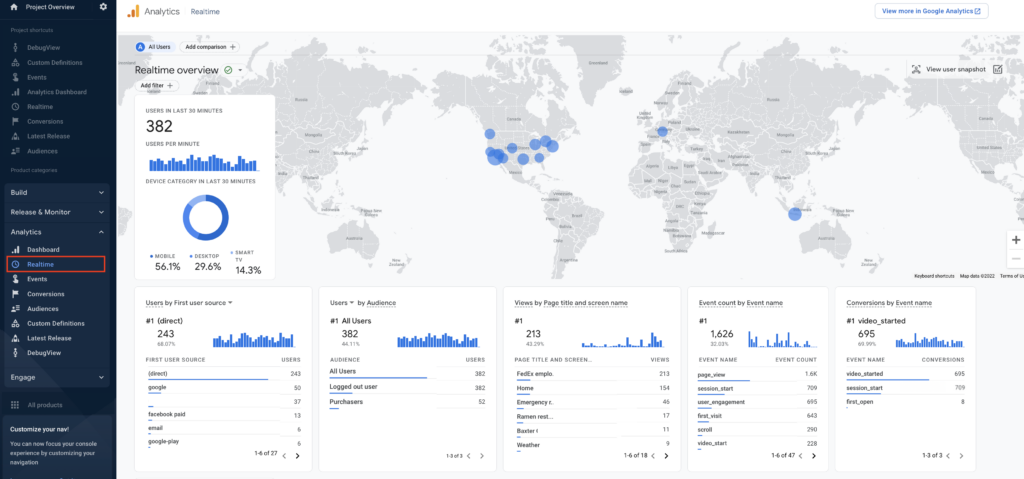
The Realtime section allows you to get realtime data about your users at any hour of the day. Similar to the Dashboard section, you will find widgets that provide quick insights on usage and user behavior. Some of the information that I find particularly useful is the device category breakdown, the event count, and users by first user source. One interesting feature of this section is the “View User Snapshot” button found in the top-right corner of the map. This section allows you to track one of your anonymous users at random. You will find a breakdown of the user’s device, geolocation, and most importantly can track their behavior in real time using your custom events in a UI similar to DebugView.
Events & Conversions
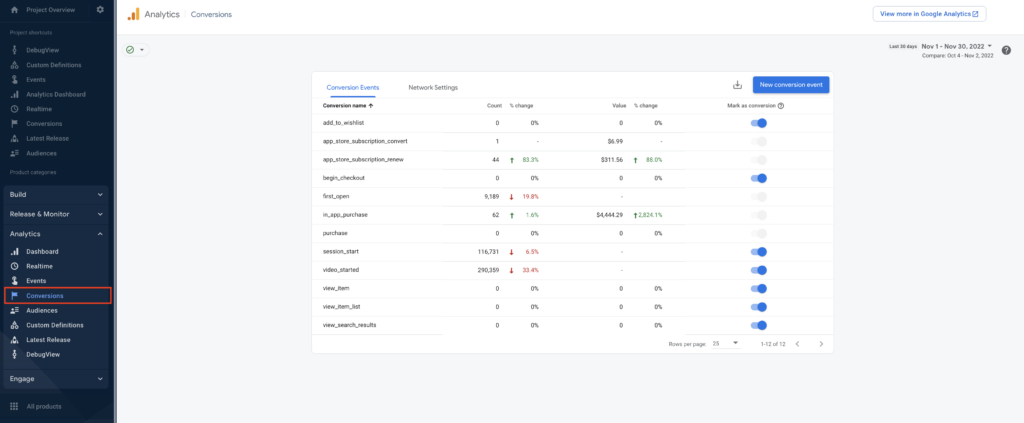
Using the Event section, you can keep track of the events that are currently being sent to Google Analytics for Firebase (note: use snake case, and lowercase when naming). In this section you can also decide which of your events you think are “key user actions that are valuable to your business” and mark them so as a conversion. I recommend spending some time thinking about your conversion events to keep the conversion reports optimized and relevant. Examples of conversion events include a product purchase or a user subscribing to your newsletter. This section also allows you to modify or create events; common reasons to do this include:
- Simplifying reports by using the same event name across properties and data streams
- Fixing a measurement error caused by a typo in an event’s name, conditions, or parameters
- Creating a new event (based on an existing event) and trigger it on specific conditions
- Narrowing the scope of an event and mark it as a conversion
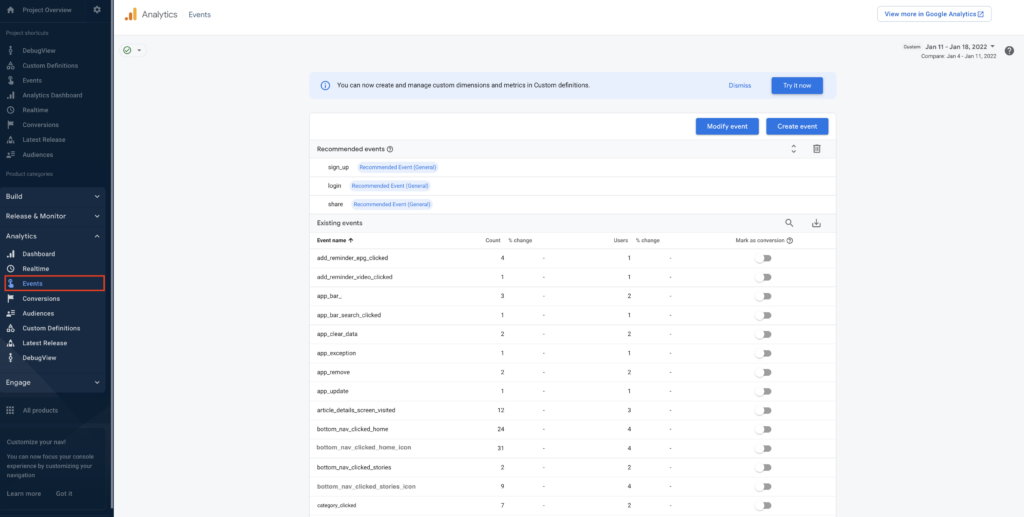
In the Conversion section you can gain quick insights into your conversion events as well as downgrade any events you feel should not be a conversion event. For more detailed reports, I suggest heading back to Google Analytics and making use of the standard & custom reports available in the UI.
Custom Definitions
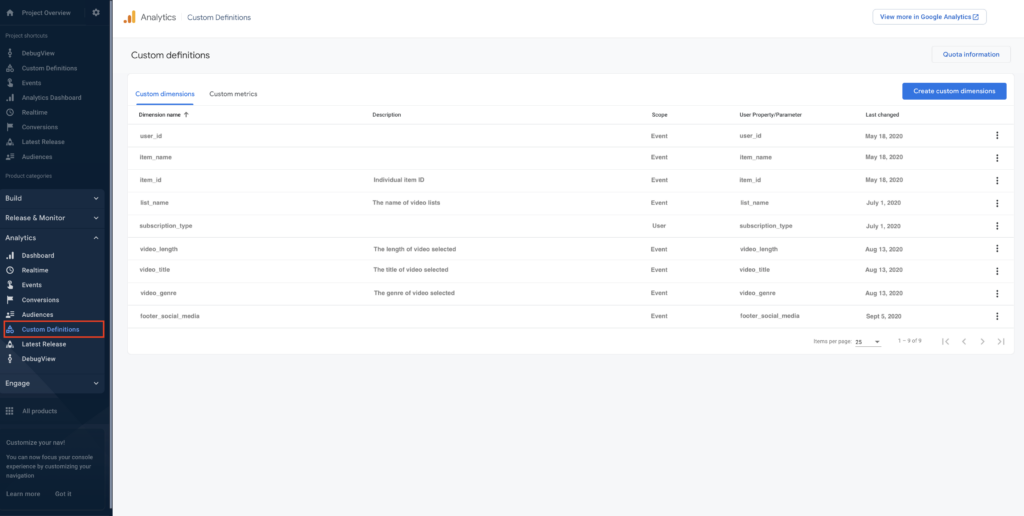
In this section you are able to register your various custom dimensions and metrics that you are tracking with your custom events. At the time of this article, you are able to either register your Custom Definitions as Event or User scope. I would also recommend adding a description so other users can easily tell what the Custom Definition is tracking (note: use snake case, and lowercase when naming).
DebugView
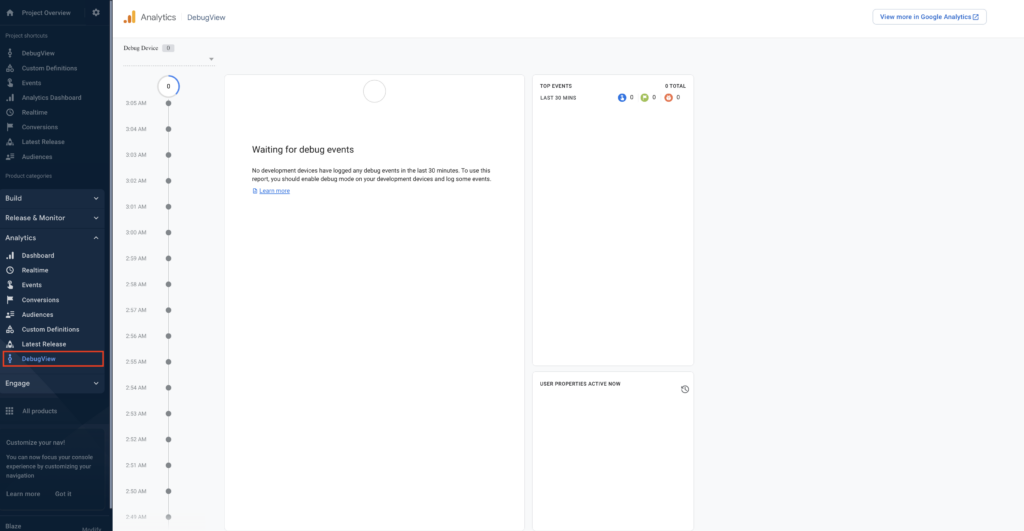
The DebugView feature allows you to test your event implementations. This tool both allows you to ensure that events are firing properly and tracking the appropriate Custom Definitions. I would highly recommend using this feature to test all new events.
Conclusion
Firebase has an abundance of tools and features that are useful for both developers and marketers. If you haven’t already, make sure to check out my previous articles on Firebase by Google. If you’d like to discuss the current and future setup for your mobile application tracking and analytics, reach out to the team at InfoTrust.

