

As users continue what I like to label as, “The Great Google Migration” from Universal Analytics (UA) to Google Analytics 4 (GA4), they are all met with a shiny new user interface that is sleek, quick to react, and customizable. However, they curiously ask the simple question, “Where are all the reports?”
What they are referring to is the difference in standard “pre-built” reports that are included in the Google Analytics user interface. For comparison, UA has roughly 25 different standard reports (depending on various product integrations) for users to access in the Acquisition Reports section, while GA4 has a mere three standard reports.
While this is a large reduction in the number of standard reports that you might see in GA4 and might be an adjustment that is difficult to get used to, it is all done for a reason. The purpose that Google has in mind is allowing users to more easily customize their experience to what they want to see and how they want to see it.
In this article, we will be taking a deep dive look at the one customization feature that Google Analytics offers to help bridge the gap between UA and GA4 in the Exploration Reports.
Exploration Reports – Overview
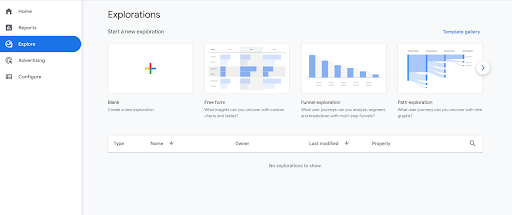
The Exploration Reports (located in its very own navigation section, Explore) feature a flexible drag-and-drop user interface that allows for the visualization of data in a variety of formats and reports. This promotes a more purpose-driven analysis and encourages the user to truly understand what story the data is trying to tell.
The various reports that you can find in the Explore Section are:
- Free-form Exploration
- Funnel Exploration
- Path Exploration
- Segment Overlap
- User Explorer
- Cohort Exploration
- User Lifetime
For those who have had access to a GA360 Licensed account, this might sound very familiar as these reports have been available in Beta for users to utilize for a little while. However, these reports will be much more important as users migrate to GA4, especially if utilizing Google Analytics day-in and day-out.
The Exploration Reports don’t only help bridge the gap between the smaller number of standard reports in GA4, but it also serves as a substitute for UA’s Custom Reports feature. However, the Exploration Reports boast a much nicer and more user friendly design, while also offering more advanced features like tables and a large variety of graphs.
As we break down each of these reports and detail the various use cases where they might be beneficial in helping find a solution, we encourage you to think through the various use cases and pain points you experience.
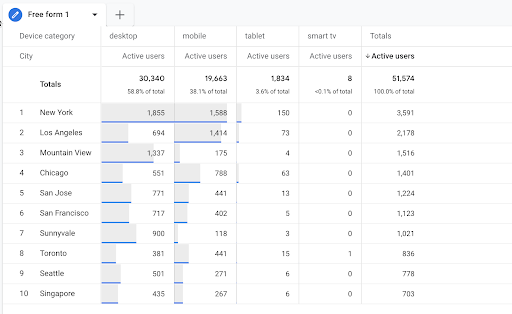
Free-Form Exploration
Reporting Features
- Enables the ordering and arranging of data in a variety of visualization formats such as tables and graphs format
- Add multiple dimensions and metrics to one report to easily compare
- Dive deeper into the analysis by applying a variety of filters and/or segments
- Easily create segments and audiences from specific data points for deeper analysis or remarketing purposes (via a right-click)
Use Cases
- Quickly answer simple day-to-day/one-off analytics questions
- Visualize data in a variety of ways that help tell a better story when comparing multiple dimensions and metrics
- Analyze similar dimensions to determine where they are similar and where they might be different
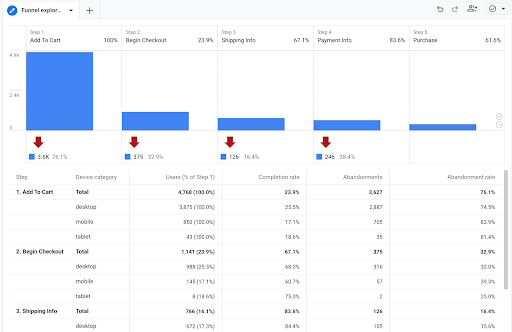
Funnel Exploration
Reporting Features
- A visualized funnel of user-defined steps that shows where users succeed or fail at completing identified steps
- Enables users to define specific time constraints where a specific action must be completed
- Easily create segments and audiences from specific data points for deeper analysis or remarketing purposes (via a right-click)
Use Cases
- Identify where users are dropping-off in specific form or purchase/check-out flows and create a retargeting audience
- Identify the group of users who have completed specific form or purchase/check-out flows and create a suppression audience to enhance efficient ad spend
- Visualizes where flow optimization (A/B testing) might be beneficial due to possible user confusion
- Analyze the impact of various flow optimization practices
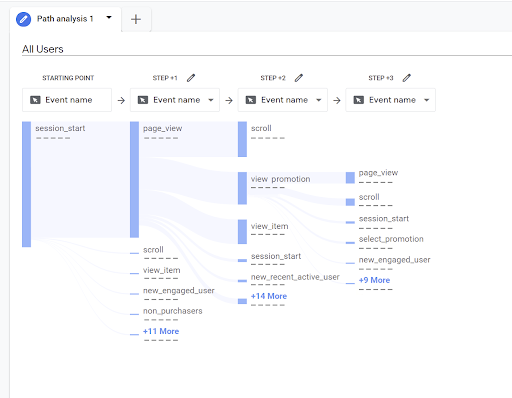
Path Exploration
Reporting Features
- Simply define the event or page that is an interest as the starting point
- Determine the effects of a specific event or page on the subsequent user interaction
- Simple click through reporting user interface that allows the user to easily see the next user interactions based on the previous interaction
Use Cases
- Identifying potential looping behaviors among your customers as this could imply that there is confusion
- Determine potential events or pages that have positive or negative impact on identified user outcomes
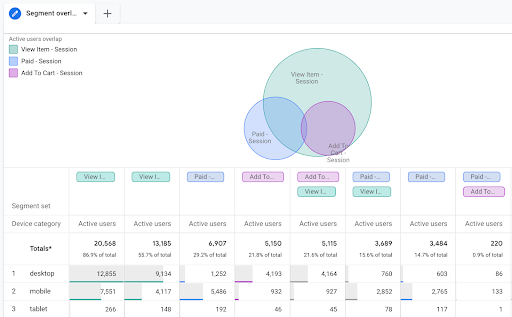
Segment Overlap
Reporting Features
- Quickly analyze up to three segments to see how they overlap and relate to one another
- Use specific dimensions and filters to break down and uncover more details about the identified segments
- Easily create new segments from the data and use them for deeper analysis
Use Cases
- Understand how different customer segments overlap with one another
- Identify what user segments contribute more to a specific identified conversion
User Explorer
Reporting Features
- Drill down deeper into each individual user’s activities
- Better understand each individual’s user behavior across both app and web interactions
- Enables the ability to troubleshoot user anomalies and gain insights on these specific user flows
Use Cases
- Better understand where users possibly experienced issues like placing orders or completing a form
- Enhance user personalization ability based on observed user experiences and determine ways to encourage more engagement
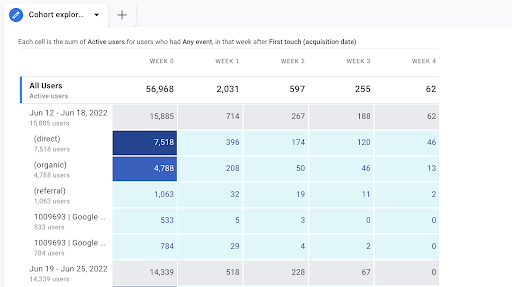
Cohort Exploration
Reporting Features
- Provides insights on a group of users who have shared characteristics
- Understand the behavior of the specific cohort groups over specific periods of time
Use Cases
- Helps identify what users are responding to specific campaign tactics and how they engage over time
- Determine what potentially caused a group of users to stay more engaged when compared to other groups of users
User Lifetime
Reporting Features
- Provides a detailed breakdown of users and their corresponding expected lifetime value
- Provides unique behavior insight about when users last purchased and which active campaigns are more than likely going to lead to less churn and higher purchase probability
Use Cases
- Can help determine which source/medium/campaign leads to the highest user lifetime value thus leading to more efficient spend
- Helps make more informed spend decisions when it comes to current active campaigns and acquiring the most valuable users

Over the next few months we will be taking a deeper dive into some of these Exploration Reports and the best practices when it comes to setting up your own exploration reports. Please be on the lookout for these articles if you are interested in learning more about the Exploration Reporting section.
Conclusion
As wrap-up, it is important to note that the Exploration Reports are a very nice alternative to the standard reports; however, these reports are systematically different from each other. Therefore, the Exploration Reports that are built are not able to be shown alongside the standard reports.