
With the Google Marketing Platform, you can create stunning dashboards using Data Studio. Data Studio enables teams to easily create dashboards in order to visualize the most crucial information needed to meet their goals and objectives. For those without Data Studio experience, one of our Advanced Analysis and Digital Visualization Specialists, Dan Vivaldelli, wrote a great article on Data Studio best practices that you can find here.
Think your organization is ready to dive deep into Data Studio? Here are some things to consider to get you started.
Benefits of Data Studio
- Connect to Multiple Data Sources: You can sync many different data sources within the Google Marketing Platform such as Google Analytics, BigQuery, Google Sheets, and many more.
- Unlimited Data Caps: There’s no cap on how many data files you can upload or how many pages you can have. You can also have up to 50 visualizations or graphs per page.
- It’s FREE: Most data visualization tools require a monthly subscription fee if you want to connect multiple data sources. While there are other free tools, most have a limited capacity and can only connect files from Google Sheets or Excel.
- Free Online Resources: Since it’s a Google product, you can sign up for Google’s Analytics Academy courses that show you the basics of setting up Data Studio and troubleshooting guides. This course is very helpful if you’re starting out with Data Studio.
As you can see, there are many benefits to utilizing Data Studio. But, as with most free tools, there’s also some drawbacks. Here are some of the common pain points we’ve seen throughout our extensive Data Studio partnerships with our clients.
Common Limitations with Data Studio (and How to Solve)
1. Measuring Custom Channel Groupings and User Funnels in GA
Custom Channel Groupings allows you to analyze the performance of marketing channels or traffic sources. Enhanced eCommerce checkout funnels, on the other hand, are useful when analyzing each step of the consumer/user journey. Unfortunately, setting up both custom channel groupings and funnels in Data Studio does require extra configurations.
Solution
CASE statements and calculated fields are great alternatives to building out custom groupings and breaking down user funnels. CASE Statements allow you to group data together by using conditional logic. Calculated fields allow you to create new metrics and dimensions by using formulas.
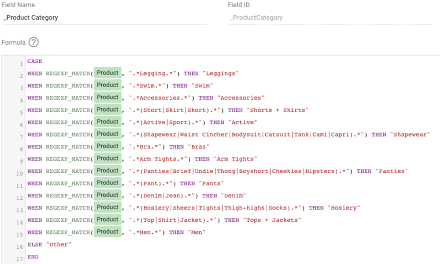
For channel groupings, you can use CASE statements to group your set of marketing activities. Here is an example of a CASE statement used to categorize different products into a certain group:
For user funnels, you can use calculated fields in order to break down each step of the consumer/user journey into one graph and case statements to create individual goals. Here is a step-by-step guide on how to create a user funnel:
- Using calculated fields, create a goal conversion (located in GA) where you take goal/sessions for each individual goal (i.e. goal1/ sessions, goal2/sessions, etc.).
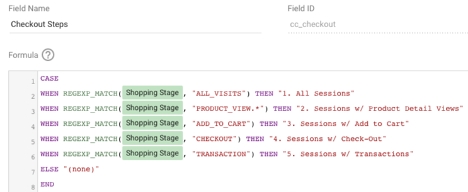
- Use the CASE statement to create each step of the conversion drop-off. Here’s an example of how you can break individual pages of your site into case statements.
- Create a horizontal bar graph with the scorecard metric displaying the conversion. Here is an example of how you would want to display a user funnel. You can create a scorecard metric or % change column to visualize % conversion for each goal. It’s best to set your goals on the left side and place your scorecard metrics on the right side of each bar as shown in this image.

2. Blending Data Sources
Data blending allows you to compare different data sources within a single table. There are two main issues with data blending in Data Studio.
- You can only blend up to 5 data sources into the report.
- If you have datasets where a dimension or metric doesn’t match, you will have missing data. For instance, in GA, if you are comparing two properties and one dimension/metric is named differently, then you’ll have missing data on anything that doesn’t match the left most data set.
Solution
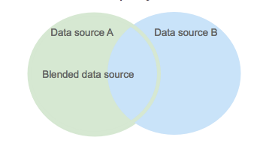
It’s important to note that the data source is the result of a left outer join (Data Source A). Therefore, make sure the data source in Data Source B matches directly with the left outer join (Data Source A). This image below shows how data sources are joined. Once the Data Source B is joined by the left outer join in Data Source A, the blended data will include any data within Data Source A.
Before you start data blending, make sure the dimensions and/or metrics have data and the same naming structure. If you are blending in GA, it’s best if you join a simple dimension or metrics (i.e. pageviews, date, sessions, etc.) as properties will most likely match and have data in each of those examples. I’ve provided an example below of how to set up a data blend between two GA properties.
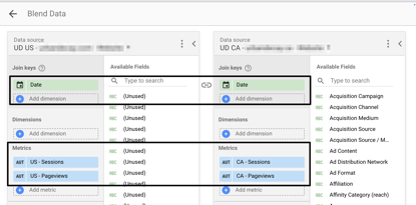
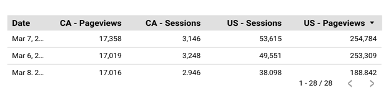
Here is what the joint table looks like. Make sure if you are joining a property that there is data in the section you are joining.
Alternatively, outside of Data Studio, we’ve found that pulling data into Google Sheets to blend has been very helpful. If your blending does not have to be done in Data Studio, you can also look into Google Sheets as a potential solution. Google Sheets has an Add-On to connect to Google Analytics.
3. Transferring Ownership
If you are working with a team or with a client, giving full Administrative/Ownership access in Data Studio can be challenging.
Solution
Here are the steps I’ve found to be most useful when a client is wanting full rights to the dashboard. *Note, you will need admin access to your teammate’s/client’s Data Studio account in order to transfer ownership. If you can’t get it, they will need to follow these steps.
- From your account, share the data sources and the report to your teammate’s/client’s email. Make sure you grant them Edit access when you’re sharing the report and data sources.
- Sign into the other person’s Data Studio account, pull up the shared report, and make a copy of the report.
- Add in the shared data sources and reconnect the data sources.
3. Performance and Speed
We’ve noticed the performance of Data Studio can be hampered depending on the data set being used. For instance, if you are connected to a large table in BigQuery or even GA with many rows and columns, Data Studio can get bogged down and take a while to load the dashboard. Additionally, if you have a large data set over a long period of time in GA, you can run into sampling issues.
Solution
Try and summarize (pre-process) your data set as much as possible in order to speed up the loading time. The purpose of dashboarding is not to show every piece of your analytics portal, but to showcase the most vital information to get a high-level picture of your KPIs.
To minimize sampling data, set a smaller date range. The free version of GA pulls in sampled data, therefore, if you connect GA directly to Data Studio, you will have some sampling of data in your report. By having a smaller date range, you can decrease the sampling percentage in Data Studio.
Hopefully this post has been helpful in laying out the benefits of Data Studio, along with some of its current limitations. We love Data Studio because it’s a free tool that connects with many of the Google data sources we use every day, like Google Analytics and BigQuery.
Have a Specific Question About Data Studio?
Our InfoTrust team works with clients to ensure that they are getting the most benefit from their platforms. A member of our team would be happy to help you!