You’ve likely seen the abbreviation for Intelligent Tracking Prevention, ITP, strewn across the headlines of tech and marketing blogs over the past year. The amount of browser changes affecting how cookies and measurement works has spiked recently, and will only likely continue.
Before we dive too deep into how ITP (Safari), ETP (Enhanced Tracking Protection from Mozilla), and other browser cookie changes are impacting you, let’s ensure you’re up to speed on the basics of these features. Here are a few helpful articles from InfoTrust to kick things off:
- What Is ITP and What Does It Mean for Web Cookies?
- How ITP May Impact Your Analytics (Plus a Solution for Measurement)
- [Video] Measurement Changes and Updates June 2019: ITP Solution & Mobile App GTM v4 Deprecation
Okay, now into the thick of it!
While ITP and similar browser changes may seem scary and daunting for how online measurement will be affected, you can quickly check the severity or impact of these changes. Anyone that has users coming to your site from Safari, Mozilla Firefox, and Microsoft Edge should perk up, as these browsers have made the most visible changes to measurement. Even Chrome has made updates to some degree, though not affecting cookies as much as others. Even if Safari, Firefox, and Edge combined comprise less than 20% of your total web traffic, your marketing and advertising analysis will be affected.
Here’s a quick look at which of your metrics will likely be affected–and what you can do about it.
1. User Counts By Browser
Does it seem like you’re getting more visitors to your site and that more people are using Safari, Firefox, and Chrome? But, at the same time, conversion-by-user counts overall are going down?
Cookies have a shelf-life now that may not be uniform. Depending which browser and how users are engaging with your site, as well as their browser settings for privacy/data collection, cookies may only be available for 30 days, 7 days, and even only 24 hours before they expire. As of today, Google Analytics and other tools use cookies to determine if/when the same users are coming back to the website on the same browser. If these cookies are deleted or expire, and on return visits new cookies are created by your measurement tool (like Google Analytics), you suddenly track yet another new user, even though it’s not a new human. Due to this, your data can show a gradual increase in user count, which also in turn may reduce your user-level-conversion rates simply because you are increasing the denominator in the rate calculation: Conversions / Users = Conversion Rate.
Here’s a scenario that demonstrates this in action:
100 users from Safari come to your site a year ago; 2 months after their first visit, they all came back on the same browser, and 50 converted. So, your conversion rate is 50% for these 100 users (50 / 100 = 50% across the entire 2-month period).
Let’s assume this same scenario starts today. 100 users from Safari come to your site today, and 2 months after their first visit, they all come back on the same browser and 50 convert. In this case, you’d have 200 total users, since their first visit wasn’t stitched with their next visits and appear as new users. And, since it’s still 50 conversions, your conversion rate is now 25% across the 2-month period. Ouch! More users and lower user-level-conversion rates.
In Google Analytics, you can quickly check to assess the impact by booting up the Basic Browser Report (Audience > Technology > Browser & OS) and setting the date range to be 3 months back vs. 3 months before that (or modify to however long your sales/buying cycle may be). What is the percentage of your Safari, Mozilla, or Edge browser traffic in these two date ranges? You can definitely expect the user counts to differ as time passes and the cookies are cleared/expire.
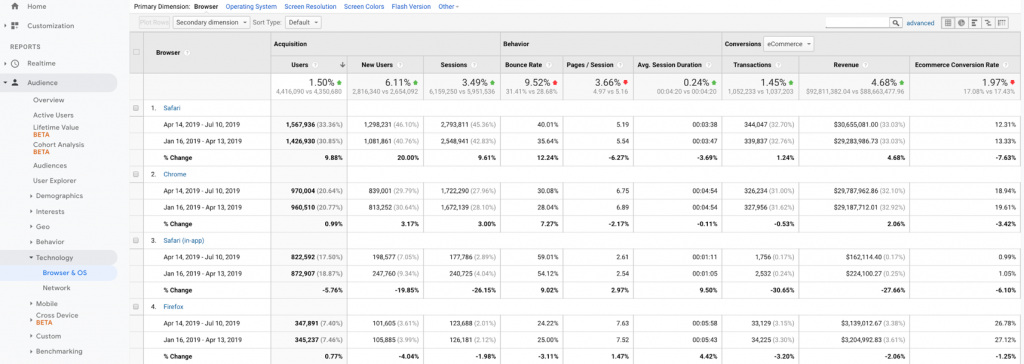
For a custom report of the same data, click here.
2. Users: New vs. Returning
Aggregate user count is not the only user-related metric or dimension affected. The split of new vs. returning user is also impacted, with a likely increase in “New” and decrease in “Returning.”
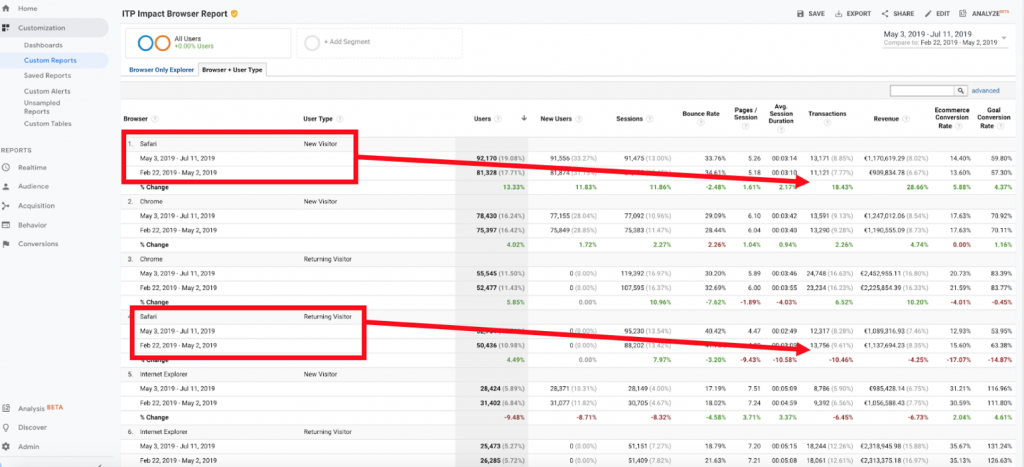
This gets even more complicated when you want to ensure cross-domain tracking is in place, as cookie data needs to be passed/shared and requires even more technical work (solutions below). To check for this impact, you can either go to the New vs. Returning report (Audience > Behavior > New vs. Returning), but apply a secondary dimension by browser or use the report from above and apply the secondary dimension there. You can also simply click this custom report to see just how many new vs. returning users you have today against browser traffic and check the changes between the volumes of each over the last time period (up to when ITP 2.2 rolled out, around May 1, 2019). Do you see the shift in new vs. returning, especially for Safari?
Example in action: In the report below, notice how Safari traffic (specifically for New Visitor User count) had much higher increases and significant lift in conversions compared to Returning Visitors:
3. Attribution
Does it appear that your bottom-of-funnel campaigns are cranking more conversions lately, while display and other top-of-funnel campaigns are showing fewer conversions?
Consider the first scenario explained above where your user-level conversion rate dropped from 50% to 25%. Without persistent cookies between multiple sessions made by users, you can say goodbye to longer path length attribution modeling and multi-channel funnel reporting (or at least take it with a grain of salt, depending how high your traffic/conversion counts are from Safari, Mozilla, or Edge, primarily).
Without the same cookie persisting, if a user does not convert within the same Lookback window as the cookie expiration date, his/her subsequent sessions that lead up to the session with conversion will be lost or unattributable. This means you’ll likely see a drop in credit that can be applied to upper funnel channels (like Display) and more given to lower funnel (Paid Search, Email) and generally more “Direct” traffic conversions without any previous sources/sessions influencing the customer journey up to converting.
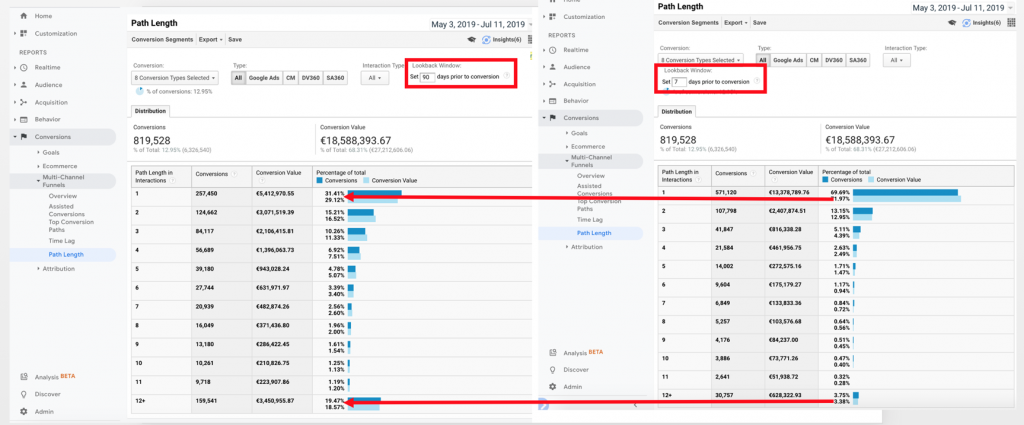
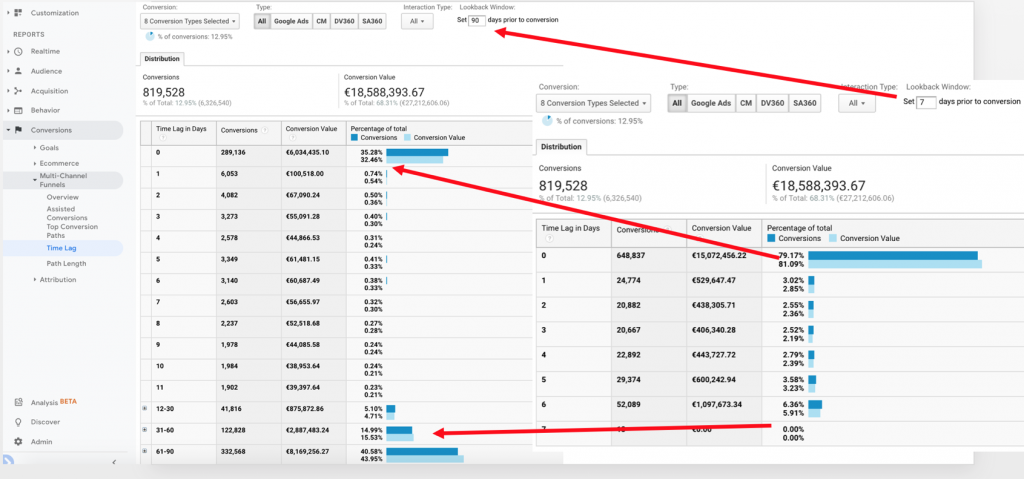
The best way to check if this will impact your reporting is the Path Length report, as it shows you how many sessions users take that lead up to a conversion. Note that it’s useful to make the Lookback window here 90 days (maximum) to get a full sense of the number of times a user returns before converting. Seeing how many sessions users come back to the site before converting, coupled with the Time Lag report for duration between sessions leading up to a conversion, allows you to see where the 7-day or 24-hour expiration will alter the campaign attribution for all your conversions. This makes attribution-modeling a bit trickier.
In the example reports below, notice the difference in Path Length between the 7-day Lookback and 90-day Lookback windows for conversions that occur after 1 session.
When measuring channels and campaigns that are most effective, changes like ITP for Safari and other browsers can drastically modify how you measure attribution and overall how you should optimize your media spend. Some upper-funnel, early-in-customer-journey, stage-based media may suddenly have no ability to tie back to the end conversion, and thus gets no credit at all, impacting how you allocate media spend and determine value for all types of campaigns. (Don’t panic, there are solutions that can help maintain some of these capabilities. Contact InfoTrust today to learn more.)
4. Mobile & Tablet Traffic
The most recent measure of mobile browser market share in the U.S. (by Statcounter for January to June of 2019) placed Safari in first place, with 49%, followed by Chrome, with 43%. For desktop browsers, Safari has only 8% of the U.S. market share.
If you know you’re getting mobile traffic to your website, it’s time to identify the magnitude of Safari’s ITP update on your website traffic by finding out what the percentage of mobile traffic and the typical sales cycle for your mobile conversions are.
See if the Safari market share statistics apply to your website traffic by going to the Mobile Overview report (Audience > Mobile > Overview). In this report, you will see how much mobile traffic you receive. From there, apply a secondary dimension by browser to assess the proportion coming from Safari. Because we like to make things easy, simply click this custom report to see the same.
In the below example, the numbers are in line with the overall market share:
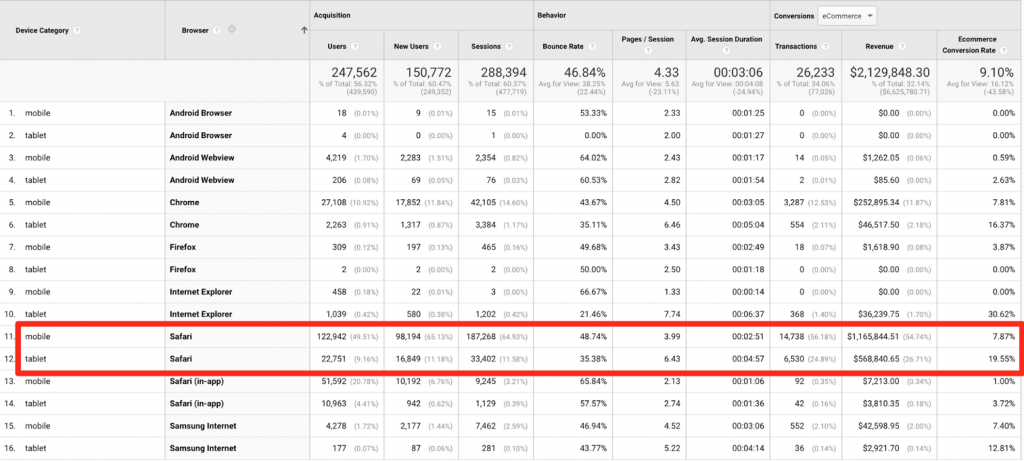
Knowing how much business is coming from mobile and tablet traffic is also important for the attribution-based and user-level conversion analysis. You can see those details in the Mobile Overview report (screenshot below). In the below example, you can see that mobile and tablet traffic comprise about 50% of the overall website traffic and account for 30% of the revenue. With half of that going through Safari, you now have an idea of how many conversions are potentially impacted by the ITP updates.

If you have campaigns running specifically for mobile, this becomes crucial, as attributing value to mobile search will become a complex process that requires a wide array of technical and marketing skills.
Your Next Steps
Despite the worrisome changes listed above, even if you have a majority of your traffic coming from these browsers, online measurement is not dead. Many folks at our vendor partners are planning for a cookie-less world. While this may eventually be the case, there is still a lot of value in not only understanding and accepting these changes, but also looking for ways to analyze better, differently, and explore alternatives to capture cookies via third-party JavaScript technologies. This is why we are so excited about some of the solutions, including server-side cookie setting leveraging Google Tag Manager and Google Cloud.
Contact the InfoTrust team to learn more about solving for ITP, ETP, and other cookie-expiration challenges.
Bonus: For an even better grasp of what cookies are being deployed on your site–and by which vendors/tags–as well as how to wrangle all your data and tag management, check out the latest data governance feature updates by Tag Inspector.

