

Stéphane Hamel is everything from a keynote speaker to a freelance consultant, and is known as an industry expert on digital analytics. In fact, Stéphane developed the Digital Analytics Maturity Model, which we had the great honor to sit down and discuss, as well as how far the digital analytics industry has come.
About Stéphane Hamel
ML: In the space of digital analytics, you do not need an introduction, but let’s say you’re talking to somebody who does not know you or Google Analytics. How would you introduce yourself?
SH: I simply say I do statistics about websites. I look at who’s coming to the site, what they are doing, and whether it’s working for them and for the business. If they still don’t understand, I put it in a more funny way: “I stick a thermometer in the website to see if it’s doing well.”
ML: What inspired you to pursue a career path in digital analytics? You are one of the most well-known contributors and experts in digital analytics. What do you feel was the tipping point of how you decided to go in this direction?
SH: It’s hard for me to really put a finger on the tipping point where I said “this is what I want to do.” Throughout my career, I’ve always been involved in projects where there was data, a business problem to solve and a good challenge. There is always something to analyze, something to improve, and this started long before the web.
I was working on a research project at the time the web came out. It was natural for me to install a web server and start documenting the project I was working on. As a system administrator, data administrator and computer engineer, I mastered all the components to understand the data in this business context, and make sense of it. So, it started before the web and naturally went in that direction.
ML: Right now, as I understand, you work as a freelance consultant.
SH: Yes, exactly. I decided to come back to the freelance side because I’m a free electron (and maybe to difficult to work with! Ha! Ha!) This freedom allows me to explore different opportunities and avenues. I do consulting, of course, I teach, speak at events, write, advise startups and agencies, and create proof of concepts and tools.
ML: When you do consulting, are there certain projects that you consider to be sweet spots, or the ones that you’re most excited about?
SH: There are a couple of types of engagement I prefer. I do a lot of coaching, and being on the freelance side allows me to do coaching and training of agencies. Many smaller agencies need guidance and training.
Part of what I do is basically coaching agencies so that they can develop their own services with their clients. It’s like “train-the-trainer.” The other type of project I do is when a client or an agency contacts me and says, “We have this project, we’re not too sure it’s going to work, and we don’t exactly know how to do it. Can you look into it?” Those are pure research & development projects. I relieve them from the risks associated to this uncertainty and I take care of this very narrow part of the project that requires more expertise.
The way I approach it, maybe because I’m crazy and passionate about it, is when that happens, oftentimes the deal is something along the lines of, “Okay I can look into it, but there’s no guarantee that I’m going to be able to solve this.” Basically, the compensation is going to be based on whether I can solve the problem or not, which represents a low risk for the client. If I can’t really solve the problem, at least I’m going to be able to explain why and offer alternatives. Those are very interesting projects because they allow me to stay abreast of the latest challenges faced by organizations. What are the latest concepts, tools or techniques that could solve a specific problem? The other part of my job is also to act as an advisor or independant sounding-board to a number of start-ups in the industry. As a recently approved Google Strategy Expert, I consider this an important part of my role.
ML: With that in mind, you’ve touched on start-ups that you advise. For enterprises, when looking at digital analytical solutions, there are clearly very established players in analytics, and there are number of point solutions. How do you suggest an organization makes the decision about when they’re better off to invest in a complete stock from an established company versus when they should explore one of the new, up-and-coming players?
SH: That’s a very interesting question. I get asked that very often. The way I see it, it all boils down to something I’ve been studying for years: the concept of digital analytics maturity. It really depends on the maturity of the organization whether they should go with one vendor vs another and leverage its capabilities. Should you pick Adobe Marketing Cloud or Google Anlaytics 360 Suite? Go for Google Analytics “free” or a point solution the two biggest players are not addressing? Or maybe a vendor like Webtrekk or AT Internet who have strong presence in Europe? Actually, selecting a vendor based on its features only plays a minor role in the overall value digital analytics can bring to the organization.
It’s not only a matter of tool, as I demonstrated with the maturity model. You need to consider Governance, Objectives & Scope, the Team Expertise and the continuous improvement Methodology. How useful would it be if you finally get the best tool in the world (if that exists!) but all the other dimensions of success are not aligned?
Back to the initial question, how do you decide between vendors? I think the first question to ask is rather, “what are your capabilities?” The AdTech and MarTech landscape are crowded with tools and technologies, everything is possible. That’s not the point. Think about whether you’re going to be willing to invest in developing internal skills (and working with external partners to fill the gap), and the resources and level of commitment necessary to change the organization culture to become more data savvy.
ML: You mentioned Google Analytics 360. As a super-user, what are your thoughts of the sweep?
SH: I think there’s a lot of potential, and even if most of the components are still in beta, they already offer tremendous value to organizations that are willing and ready to leverage them. I have absolutely no doubt that they will quickly achieve parity and even go beyond other solutions in the market. This industry is fascinating – and I wouldn’t want to be in the shoes of a Google competitor – because they are disturbing the market once again.
The other aspect is the ecosystems. There are players that probably feel very harshly that Google is coming and basically attacking, replacing or challenging the product that they have been working on for several years. It will be very interesting to see how the market is going to evolve.
ML: You’re actually an advisor to a company that displays in a similar space, Klipfolio, correct?
SH: Yes, Google Data Studio can be considered a competitor of Klipfolio. I’ve been involved with Klipfolio for several years. As a disclaimer, I should say I don’t have any financial interests in Klipfolio, I’m not a share owner, and I’m not currently getting paid to talk about them. When I find something interesting, especially something I use myself, I have absolutely no problem sharing what I call “the social love”. Klipfolio has 15 years of experience developing dashboard solutions, they have great data connectivity (something Data Studio is still lacking but should improve over time), their dashboard technology is very solid and powerful, they have pre-built dashboards and widgets to start with, plenty of training & learning resources, and tons of agencies are leveraging the platform with their clients. On top of that, Allan Wille, the CEO and the whole team are just fantastic. (Hint: you should follow Allan’s blog, where he honestly and transparently shares how it is to run a company like Klipfolio)
There are many players in the dashboarding and data visualization space, and there will be further consolidation and transformation in this niche market. At one point, you need to pick a solution and just go with it. Data Studio has its place, so does Klipfolio, and I also use Tableau extensively. This is why, in my opinion, understand concepts trumps deep knowledge of a given tool. Soft skills and experience will empower you to learn a new tool, and even become an expert at it. There will always be the temptation of the new shiny object but eventually you need to decide. Otherwise, you’re going to switch tools every six months, because there’s always something nicer and newer and maybe even better.
At the end of the day, your managers won’t care which tool you use – what matters is if you can empower your stakeholders to make more informed decisions.
ML: You’ve been in a space of digital analytics for over a decade. What do you think are some of the biggest changes? What things are you most excited or skeptical about?
SH: That’s really interesting because history repeats itself. When I installed my first web server to document the research project I was working on twenty-five years ago, I had to do it all. As a system database administrator, it was natural to look at log files, and even use a home made or open source log parsing tool, load the data in an Oracle database and create reports. Eventually, around 1996, marketing realized the web should really be a marketing function and took over from “IT” and “engineers.” Today, organizations still perceive digital channels as a marketing function, but they also recognize the capabilities transcend all business functions.
Typically, some functionalities tie directly to the core business. Ecommerce hooks up to CRM, sales and inventory. A car manufacturer has a “build & price” tool that offers customizations that directly relates to engineering. In the travel industry, the booking is hooked up directly to a pricing engine and inventory, etc. The simple truth is those components, as much as marketing would love to control them, are still largely an IT responsibility and needs to be developed jointly and collaboratively. The same exact thing happened with web analytics, and now we call it digital analytics. At first it was an IT function. Monthly reports were perfectly fine and everybody was happy with a couple of graphs and 3D colorful pie charts.
One day, a clever person figured out adding a couple of JavaScript lines of code to every page would free the marketers from IT dependency. Marketers were really happy and they said, “Okay, web analytics is a marketing function. We’ve got our data, we’ve got our tool, we’ve got our nice-looking reports whenever we want,” and they were happy with it. It worked for a while. It felt strange to attend predominantly marketing conferences where some speakers made fun and even despised the role of IT. How IT was slow, not understanding, stubborn and how they screwed up tagging was the recurring topic during breaks. As far back as 2008 I wrote something where I said “web analytics has been hijacked by marketing.”
The biggest change I see now, and the main discussion in the hallways and during breaks at conferences, is this: “How can I leverage my online behavioral data with my core back office systems: CRM, customers, and sales, and go beyond just what happens on the website to really tie together, end-to-end, all the data from online behavior leading to offline outcomes?” That goes far beyond the marketing function, and we’re back to square one! The ensuing talk is often about Big Data, data-science, machine learning, artificial intelligence… We’re far from the nice little reports and 3D pie-charts! Ok, I’m being rude on my fellow marketers friend – we’ve moved beyond those a long time ago. But where do we get the data? Yes… from the business intelligence team, from IT (or at least in collaboration with!) – even when using cloud-based solutions, collaboration is key. There’s overlap, there’s duplication, there are new reports, so marketers, data scientists, even Business Intelligence and Business Analysts have to (re)learn how to work together for the greater good, which is, “Given a business context, how can I leverage data to offer optimal and realistic recommendations and empower confident business decisions?”
ML: You’ve mentioned that one of the key challenges businesses have is that integration of digital or collection of behavioral data is back-end data, serum loads, and programs. Do you see any common misconceptions about digital analytics?
SH: I think the biggest misconception is one I’ve been arguing for a long time, even when talking with other industry leaders, and I’ve even written about it. I think the fact web analytics was perceived so much as a marketing function it ignored the big picture for a while. It doesn’t matter if it’s web data or digital data. It doesn’t matter where the data is coming from as long as it is relevant and useful in my analysis context I’m insisting on this because I think in a short while, maybe a year from now, we eventually won’t make a distinction whether it’s “digital analytics” or just “analytics.”
I don’t care where the data is coming from, as long as I understand the business context and the challenge I’m trying to solve or the important opportunity I’m trying to leverage. What kind of data is available to me? It doesn’t matter if it’s coming from the web, from social or competitive data, from in-house or outside. I don’t care as long as it’s relevant and useful for my analysis. My role as an analyst is to make recommendations that are relevant, useful and realistic given the context of the business.
I like to think that in the near future, an analyst will be an analyst. An analyst needs to understand the business and needs to understand how to leverage data. Then, you have people who are more inclined toward understanding the behavior of visitors on a website and others who might be more inclined towards visualizing data and statistics. At its core, the pattern and the process it’s always very similar. It’s context, it’s data, and it’s a good part of creativity because we need to be creative. We need to be able to go beyond what the competitor is doing and be creative enough to come up with new and better solutions. That’s the creative process. Creativity is not just coming out with something new. It’s also about innovation. This, to me, what analysis really is.
ML: If you were to give advice to yourself when you were just getting started in the space of analytics, what would it be?
SH: You need to have the basic understanding of the original concepts I depict as a triangle. At the top you have the “Business,” then “Enabling Capabilities,” and finally “Analysis.”
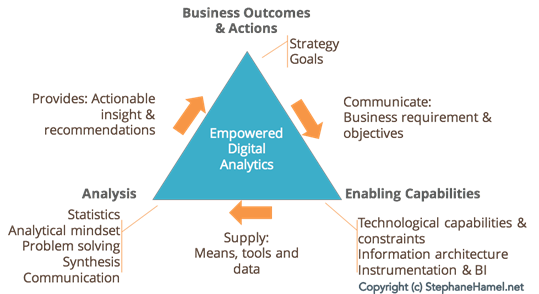
The field of digital analytics has grown to be to complex. It’s impossible to be a master of all three aspects. You need to understand the basics of all three, but eventually you need to specialize. You need to decide: are you going to be more on the business and marketing side of things and leverage your analytics skills (and leave the enabling part to someone else), or is what thrills you is understanding a business problem and leveraging your technical prowess to the business achieve its goals. Both and any combination are equally important – it’s up to you to craft your career path.
ML: Which part do you enjoy most?
SH: That’s a good question. I always say you can have a strong area. You can usually have an area that is more, “Okay, I understand that and I can do it, but it’s not what I like the most,” and then you have a weak spot. I think I’m lucky to be strong on the enabling side of things because I have a technical background, but I’m also strong on the analysis side of things because of what I’ve done in my career.
On the business side is, as a consultant, I cannot pretend to know more of the business than my clients! I have lots of experience and I have an academic background that puts me in a position where I think I can bring something to the table. As a consultant and with experience, I find I can leverage something I’ve learned in one business and apply it in a very different context. As an employee, in 35 years of experience I worked at the Montreal Stock Exchange I took the same course stock-traders take, when I worked at a high-end 3D animation software company I learned about it, at a recreational-sport vehicle I learned about manufacturing and dealer-based network distribution, then it was insurance… you get the point. What was constant? A desire to understand the business, leverage data and business processes, and tackle a good challenge! Coincidently, problem solving and analysis is a core competency of software engineers – what I studied in. But I have found everyone in our field has an interesting story about how they landed where they are today!
ML: Can you take us through your personal process for how you go about doing analysis? Let’s say you have the data sets, everything was deployed properly, and the data that was collected is actually accurate, for a change. Is there a certain process of things that you try to follow when you do the actual analysis?
SH: The question is, what is the business context? And then, do you have the right data and is it okay? This is rarely the case. I’ve had people ask, “I’m a junior analyst and I have blank-page syndrome. I don’t know where to start. What is the problem? What should I do?” There are two fields of interest that I think analysts should look into. The first one is agile development. The concept of agile is: how do you break something complex into smaller components that you can deliver more easily, quickly and effectively? In other words, what is the minimum viable product?
Couple agile development concepts with a proven problem solving methodology. In my workshops and when I speak, I stress the importance of Lean Six. It has just five steps. Any analysts can relate to those five steps very easily.
I’ll name the five steps: Define, Measure, Analyze, Improve, and Control. You Define the problem or the opportunity at hand. Measure is where you look at the data. Is that the right data? Are you missing anything? You may need to add additional data collection on your website to get the data you need; maybe it’s a survey, maybe it’s other data points that you need to have access to. Make sure you can do quality control over the data, and you can do very basic analysis on this data. Then, the Analyze step it where you put your real analysis skills at play. It’s where you look for correlation, patterns, and situations that will fuel the 5Ws a good journalist or investigator tries to answer.
Improve is where you make your recommendations and demonstrate that you can actually solve the problem or you capture the opportunity. Then finally comes Control. Now that you’ve done the change, you need to keep an eye on it. Maybe you need to review some of your KPIs and reports. Maybe you need to do training, or come back after a month, or two, or six and say, “Is the change we made a sustainable improvement for the business?”
Define, measure, analyze, improve, control. DMAIC. This works, regardless if it’s a website, mobile application, or an internal business process, you can always use these five steps to solve and improve anything, whether it’s very complex or very simple. Say the magic words three time: Define, Measure, Analyze, Improve, Control. No need to reinvent the wheel, learn about Lean Six Sigma!
About Public Speaking
ML: Wonderful. I want to ask about public speaking. You speak constantly at different conferences. How do you make sure that your presentations stand out?
SH: I think I have an enjoyable situation where I don’t have to report to anyone. I can say what I think without censorship. I might be wrong on some points, and that’s fine, because it’s also an important aspect of learning and gaining experience.
I think in our industry, there’s just too much consensus. We don’t often take the position of being a bit controversial because that’s how you make people question status quo or what seems to be the only, obvious way of doing things. That’s the style of presentation I prefer. I prefer to be wrong about something and people tell me, rather than just blindly agreeing on the status quo or going in the same direction that everyone is going. I think that’s probably one of the aspects of why I have a position of thought leadership. Thought leadership implies that you go beyond the expected concensus, but in a respectful and constructive way. If you ask, “Am I doing the right thing? What if there was a better way of doing it?” Analysts are change agents – they should always question themselves! “Better” doesn’t necessarily mean a better tool, it just means that I am more inclined to think about how to develop soft skills and new abilities. We should never be afraid to sit back, think and challenge something – because that’s the spirit of continuous improvement and it should also apply to your own career.
I think it’s also related to my presentation style. I remember one day I was presenting, and Avinash Kaushik, was presenting just before me. When he came off stage, he asked me, “What do you think of my presentation?” I saw him present a couple of times within a couple of weeks, so it was essentially the same presentation, but he changed a couple of slides. He was basically doing A/B testing on his presentation! He asked, “What do you think about slide number five?” Then I asked him, “What did you think of my presentation?” He said something I remember very clearly, “What you lack in presentation skills you got in passion,” which is kind of a nice way to say, “There’s room for improvement but your passion is what’s important.” That’s fine. Of course, I then worked on improving my presentation skills. And don’t get me wrong – presentation skills doesn’t mean nice PowerPoints. It really means presentation skills.
ML: Can you tell us a little more about what improving your presentation skills means? What specific areas did you work on, and how?
SH: I got lucky. I spoke at a large conference; there were 1,500 people in the room on a very big stage. I think it was 100 feet long. There were people to help me with content and my presentation style. One guy was basically a coach for speakers. I eventually hired him. You can always ask friends and colleagues “what did you think of my presentation?” It’s very risky, especially if you ask your boss or colleagues. They will tend to tell you how they would present it, and that’s not the point. The point is, you need a coach who, without any knowledge of your field of expertise, will know how to look at your body language, the way you move on stage, and the language that you use. Again, it has little to do with nice PowerPoints – there are plenty of books & resources for that, and you can hire a designer to help out. But nobody can replace the way you tell your story on stage.
He convinced me when he said “all the best sports atheletes have a coach, not because the coach is better than they are, but because the coach knows what to look for in order to improve.” That, for me, was the selling point. I hired the guy, and he helped me. Coaches look at all of the aspects of communication: body language, non-verbal communication, addressing the audience, looking at the audience, and all of those soft skills.
And then, presentation material. PowerPoint is just boring. We can put a huge amount of work into creating a nice PowerPoint slide, but at the end of the day, what you want people to remember is not the PowerPoint, it’s what you brought to the audience and what you said.
Advice for the Readers
ML: You mentioned Avinash Kaushik, who is obviously famous for many things. One of them is that he has an 80/20 rule. Do you have a rule or go-to piece of advice similar to 80/20 that you feel is your trademark?
SH: I think my trademark is the Digital Analytics Maturity Model, a simple way to assess strengths and weaknesses based on six dimensions of success. I can name them for you. Governance, Adoption and Culture is the first one. Another one is Objective & Scope . What is the playground that you’re dealing with, and what are your objectives? Third is the Team and Expertise.
What are the capabilities of the team? Then comes Process and Methodology. What is the process you go through in order to repeat success and increase velocity. Velocity is important. How long does it take between the time you identify the problem and the time you solve the problem? It’s agility, and agile development. How long does it take between the moment you identify the opportunity and the moment you make something out of it?
The last one is Tools, Technology and Data Integration. If you are really strong in one area or really weak in one of those five areas, it’s a recipe for failure. You need to balance all of those aspects. The free self assessment tool helps you identify your strengths and weaknesses, but it is also an amazing way to spark the conversation with your manager and stakeholders. From there, you can build a much more realistic roadmap to grow your digital analytics maturity.
ML: Can you share one final recommendation or pearl of wisdom?
SH: I would go in two directions. One is to do a maturity self-assessment. I don’t care if you use mine or someone else’s, as long as you go through the exercise of taking a step back to think, “What am I good at? Where do I need to improve,” and “What are my strengths and weaknesses?” as an individual analyst, but also as an organization. Do the maturity self-assessment, number one.
Number two is: pick one of the analysis task you need to work on and even without going into all the details, just think about Define/Measure/Analyze/Improve/Control. I guarantee you, it’s going to make a difference.
Resources and Upcoming Events
ML: Are there upcoming events where you’re planning to speak?
SH: Yes. There’s Digital Analytics Hub coming up in September, in Monterey, California. That’s a great event. How often do you have the opportunity to huddle with industry leaders and other analysts just like you and openly have a conversation about your job, your challenges. It’s an amazing place to network and hear about what others have to say in the industry. Highly recommended. I’m also going to be at eMetrics London in October and eMetrics Berlin the month after, and Superweek in Hungary in January of next year, and certainly others here and there. I would like to invite you to subscribe to my newsletter, where every week I share my thoughts about the industry, comment articles I find of value, and talk about cool tools I find.
And a closing note: don’t hesitate to reach out if you have questions or comments about digital analytics maturity, or any of the topics we covered today. I’m easy to reach, open to share my expertise, and always appreciate a good discussion!
You can get in contact with Stéphane through the following:
- Web: stephanehamel.net
- LinkedIn: linkedin.com/in/shamel
- G+: google.com/+StephaneHamel-immeria
- Medium: @S.Hamel
- Twitter: @SHamel67