

With the recent changes in privacy regulations, web browsers, and consumer expectations, multi-touch attribution models based on cookies will not be as feasible or effective in the future. To determine which marketing activities are contributing value to the business, marketers will need to adopt different, durable analysis techniques. One type of analysis is especially useful for marketing attribution: marketing mix modeling.
What are MMMs?
Marketing mix models, sometimes referred to as media mix models or MMMs, are statistical models that are used to understand the historical impact of marketing activities on the business and make predictions for the future. MMMs were developed based on the idea of the marketing mix, the factors that marketers can manipulate to drive sales. Traditionally, these factors were the 4 Ps: product, price, promotion, and place. Over time, MMMs evolved to focus primarily on advertising and pricing, which is how they’re used today to provide insights on marketing attribution.
Why are MMMs used?
MMMs have been in use for more than 20 years. They gained popularity because they are designed to explain the variability in business outcomes using discretionary marketing inputs. In other words, they can help marketers understand the impact of their past marketing tactics and provide insights into how campaigns may behave in the future, which enables future planning and optimization. Prior to the invention of digital advertising, multi-touch data collection on individual users was not possible: you could never know how many times a particular consumer saw a TV commercial or billboard. MMMs were developed to use aggregated data, such as ad exposure and spend, which makes them flexible (i.e. able to model both offline and online tactics) and durable.
How do MMMs work?
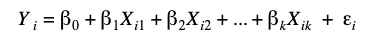
MMMs typically apply regression modeling techniques to marketing data. To start, determine which business outcome you want to explain using the model (i.e. the dependent variable); often this is sales but it could be units sold or market share. Then consider the factors that you know affect the outcome of interest (i.e. the independent variables or predictors). These should include variables that you can and cannot control (sometimes called incremental and base factors): as a marketer, you can control the ad exposure and types of campaigns being run but you cannot control macroeconomic inputs and the competition in the marketplace. It’s important to begin with a strong, comprehensive theory of which variables impact your business and then focus on which are most important and have available data.
With the theory in place, you can translate it into an equation to use for modeling.
Building the model
Although there are multiple ways to fit MMMs, we’ll focus on frequentist approaches in this post. Multiple linear regression models are the simplest technique but are often not a realistic reflection of how the variables behave and interact with each other.
It’s more common to use log-linear regression, which models the natural log of the dependent variable, or log-log regression, which models the natural log of both the dependent and independent variables.


Analysts often start with a linear model and then review scatterplots of the model’s residuals against the fitted values and predictor variables for signs of nonlinearity. Based on these findings, they update the model to better fit the data and then review the updated scatterplots to confirm that linear relationships are now present in the data.
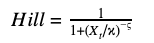
It’s generally assumed that some inputs to the model do not have straightforward linear relationships with the dependent variable. For example, it takes time for consumers to respond to advertising and these effects linger over time. Also, advertising can reach a saturation point where there are diminishing returns on additional investment. For this reason, MMMs often use the adstock variable to model the carryover effects and the Hill function to model diminishing returns.

Additionally, you may have identified interactions between independent variables; that is, cases when the effect of two variables is different from the sum of their individual effects. For example, if the impact of a promotion varies seasonally, then you may want to include an interaction term in the model to estimate the effect of seasonal promotions. To model interactions, you can include a term in the model for the product of the two predictors.

Finally, real-world data is messy and there are a number of assumptions to check to ensure the model is working as expected. Here’s a summary of common technical issues that come up when building an MMM:
- Nonlinearity: You may discover that other predictors in the dataset have a nonlinear relationship with the dependent variable. In these cases, utilizing transformations such as in the log-log model often helps to linearize the data.
- Dependent errors: When data is collected over time, there is often a correlation between the variables and the model error. A common way to resolve this issue is to include seasonal or periodic terms in the model.
- Non-constant error variance (heteroskedasticity): When checking that the errors are uncorrelated, you may find that the error variance changes over time. That is, plots of the residuals against the independent variables and fitted values show a pattern in the residuals. Transformations, such as natural log, can often help with this issue.
- Multicollinearity: The datasets used for MMMs often have independent variables that are strongly correlated with each other, called multicollinearity. Although there are multiple ways to address multicollinearity, an easy way is to remove the redundant predictors.
- Outliers: Outliers are data points that are far outside the typical observed values. When outliers occur, the best practice is to investigate them: Could they be the result of a factor that you hadn’t considered which should be included in the model? If there was an error in data collection or you can argue that the outliers aren’t representative of the overall data, they can be removed from the dataset. Otherwise, you should keep them in the dataset for modeling.
- Omitted variables: If there are gaps in your theory of the factors that impact the dependent variable or your ability to obtain the data, important factors may be omitted from the model which can bias your results. This problem can happen with any modeling project and can be hard to catch. It’s always a good idea to review the model coefficients with a subject matter expert who can help identify if something seems “off” with the model.
Model evaluation
Once you’ve built the model, the next step is to evaluate how well it fits the data. R2, which ranges from 0 to 1, indicates the percentage of variability in the dependent variable that is explained by the variability in the independent variables. Error measures, such as mean squared error (MSE) and MAE (mean absolute error), indicate the average discrepancy between the observed and predicted values. To draw conclusions about the contributions of each channel to the dependent variable and forecast future performance, it’s important for the model to have a high R2 and low MSE and MAE.
It’s also useful to review the estimated coefficients: are the coefficients statistically significant? Are the effects positive or negative and is this consistent with your domain knowledge of the business? Statistically significant coefficients may not be practically significant but significance does indicate that the predictor has a consistent relationship with the dependent variable and is contributing unique information to the model.
Insights
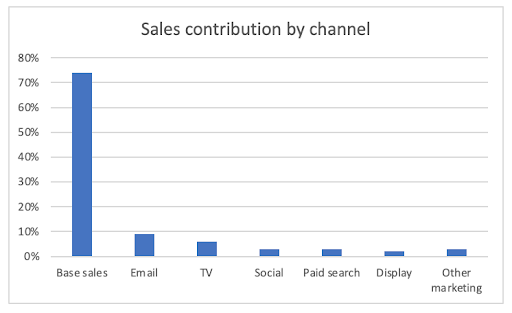
With a solid model in place, it’s time to start uncovering insights. A great place to start is by evaluating the contribution of each variable to the outcome of interest. For example, to quantify the contribution of channel M, multiply the coefficient (βm) by an actual value of the predictor variable (Xm) for channel M.
By calculating the contribution of all predictors, you can rank channels/campaigns from greatest to least impact on the dependent variable.
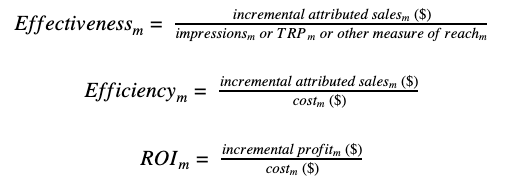
Building on the attributed contribution, you can calculate media effectiveness (incremental volume generated by each unit of reach), media efficiency (incremental volume divided by cost), and the ROI of each channel/campaign.
Finally, the model can be used for ‘what-if’ analysis and forecasting. Marketers can experiment with different budget allocations by inputting these values into the model and calculating the expected outcome. They can also be used to forecast future performance if you can make reasonable assumptions for the future values for all predictors. Just remember that the model learned from historical data inherently assumes that the patterns that were observed in the past will continue in the future; it’s not a good idea to use the model to forecast future periods that are expected to be dramatically different from the historical data used for fitting the model.
Further reading
MMMs are an active area of research and development, especially given the need for marketing attribution models that do not rely on third-party cookies. For further reading, check out these articles about enhancements to MMMs, such as utilizing geographical data and Bayesian methods.
How to bring your marketing mix modelling into the 21st century
Challenges and opportunities in media mix modelling
Bayesian methods for media mix modelling with carryover and shape effects
Resources used
Kutner, M. H., Nachtsheim, C., Neter, J., & Li, W. (2005). Applied linear statistical models.
McCarthy, J.(1996). Basic marketing: A managerial approach(12th ed.). Homewood, IL: Irwin.
Tellis, G. J. (2006). Modeling marketing mix. In R. Grover & M. Vriens (Eds.), Handbook of marketing research: uses, misuses, and future advances (pp. 506–522). Thousand Oaks, CA. doi:10.4135/9781412973380.n24