As we enter the new year, we are getting closer to welcoming Google Analytics 4 (GA4) as the replacement to our beloved Universal Analytics (UA), sunsetting in 2023 for standard properties and in 2024 for 360 properties. This means that most of you have started, or will soon start, creating GA4 properties and exploring its capabilities. While doing this, you may notice there are some variances between your UA and GA4 data. Chances are that this discrepancy is actually due to a metric most of us are familiar with: Sessions.
Both UA and GA4 track sessions. However, the way in which they define and calculate sessions are different from one another, which is why your UA and GA4 session data may not match. Additionally, we will explain where your session data lives within the new GA4 UI.

How are sessions calculated in GA4 and how is it different from Universal Analytics?
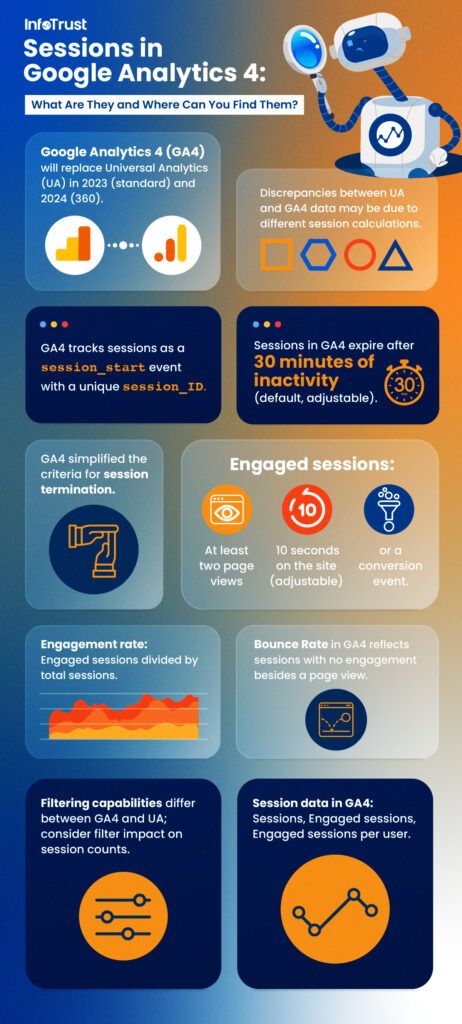
In GA4, a session is tracked as a session_start event that is automatically collected whenever a user first lands on your site. Through this event, a session_ID is also generated which serves as the unique identifier for that session.
Session Termination
In UA, a session ends when one of the following has occurred:
- There is inactivity for 30 minutes.
- The session’s campaign parameters have changed.
- The timezone used to configure your UA view indicates it’s 12:00am (a new day).
The criteria used to determine when a session ends has been simplified in GA4. A session will only expire if there is inactivity for 30 minutes (this is the default time frame and can be adjusted in the Admin settings).
Because of this change in criteria, you may notice that there are less sessions in GA4 than in UA.
Bounce Rate and Engaged Sessions
In UA, the percentage of sessions where only a page view event fires with no other user activity is referred to as the bounce rate. Although Google recently added bounce rate to GA4, new session metrics were also introduced that are intended to capture session engagement more accurately and may offer better insights depending on your use case.
Engaged Sessions
GA4 introduced engaged sessions, which are determined by the following criteria:
- Has two or more page views.
- The user has been on the site for 10 seconds or longer (this engaged session timer value can be adjusted in GA).
- Contains one or more conversion events.
Engagement Rate
An additional new metric to keep in mind is the engagement rate. The engagement rate is calculated by dividing the engaged sessions by the total number of sessions. If we take the inverse of the engagement rate, we are left with a rate that reflects how many users left the site without any sort of engagement.
This metric offers a different perspective when viewing engagement data and a more realistic representation of user engagement for certain websites, such as content sites, which may consider a session lasting longer than a certain amount of seconds without any other user interactions to be an engaged session instead of a bounce.
Additional Filtering Capabilities
It’s important to be aware of the filters that are placed in both your GA4 and UA properties. Currently, UA provides more filtering options than GA4 and may block out traffic that is being passed through to GA4. With that being said, the filtering capabilities in both versions, like view filters in UA and subproperty filters in GA4, also affect the overall session count.
Where can you find session data in GA4?
You can find the following session categories in GA4:
- Sessions – The number of sessions that began on your site or app.
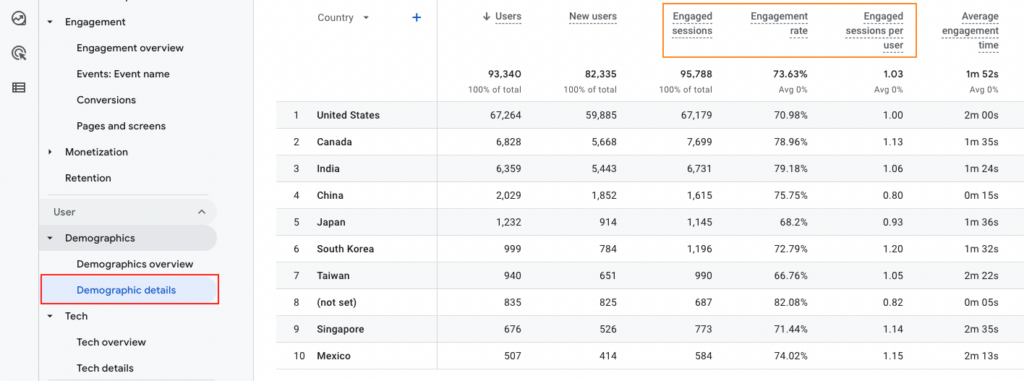
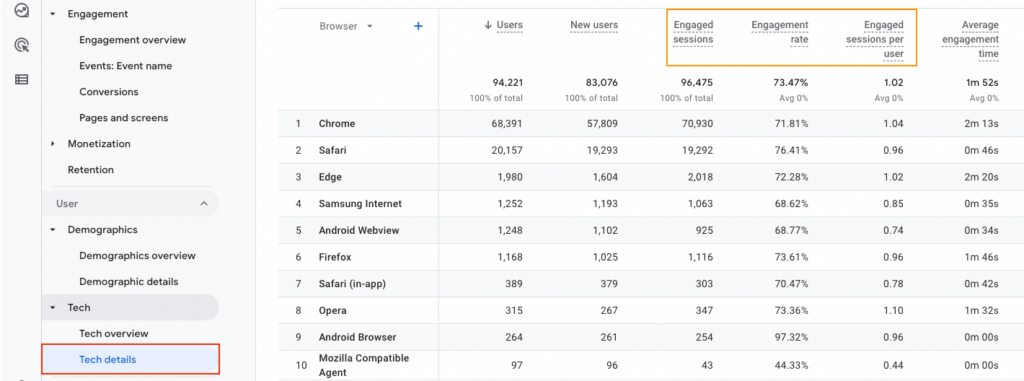
- Engaged sessions – The number of sessions that lasted longer than 10 seconds (default value), had a conversion event, or had two or more page views.
- Engaged sessions per user – Number of engaged sessions per user.
These session metrics can be found under the following reports:
Acquisition Reports

Engagement > Engagement Overview

Demographics > Demographic Details

Tech > Tech Details

In addition to these built-in reports, you can also create Exploration Reports using this metric.
Too Long; Didn’t Read
Small discrepancies between your UA and GA4 sessions are bound to occur due to the way that GA4 calculates and defines metrics compared to UA. It’s important to keep this difference in mind as you navigate through your GA4 reports and compare them to your UA data.


