

When looking at your analytics report there are numbers on numbers on numbers, you have no idea where to begin. Let me tell you, it isn’t a good feeling. You probably are recalling the very first time you looked at a report, let me guess you looked a little like this:
I sure know I did, and sometimes I still give off that vibe when reviewing reports. They can be extremely overwhelming if you don’t know what numbers to be focusing on. This really all depends on what your goals are as a company, but there are some that are important no matter what.
-
Engagement Rate
-
Bounce Rate %
-
New vs Returning User %
-
Conversion Rate
One thing to remember is that not all metrics are created equally. In different industries, different metrics are viewed as more or less important. These are the four we find important across most industries.
Engagement
Engagement is a very broad term that gets tossed around a lot. But how do you prove the user is engaged? Think about that for a second… How does your company prove the user is engaged with your website or content? Medium had a really interesting opinion of how they track their engagement.
The Engagement Metrics I find most valuable are:
- Average Session Duration
- Scroll Depth
First, Average Session Duration is pretty self explanatory. It it the average amount of time one spends during a session. This is huge because the longer the session is the more pages they are visiting, the more ads they are seeing, and as a whole the more engaged they are. This will really help you understand how well you are doing at keeping people engaged.
For example, if you are in e-commerce, you want the customer to be clicking around, checking out all of your products, and eventually making a purchase. That would result in a higher session duration. If your session duration is really short, you may have an engagement issue.
Second, here at InfoTrust, we have created our own engagement metric. It’s called Scroll Depth!
Scroll Depth allows you to track how far the user scrolled down the page. This is really helpful if you own a content site. You are able to find out what content has been read through 100%. This is your most engaging content. Promoting this on your most visited pages like your homepage will help increase overall engagement.
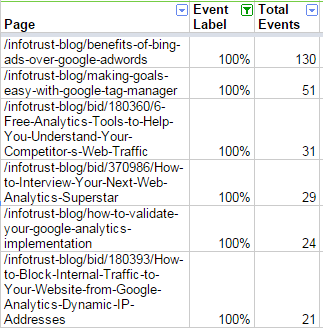
As you can see here in the screenshot above, the users found our blog on Benefits of Bing Ads Over Google AdWords the most engaging. 130 times the blog post was scrolled all the way through the page.
As you can see, engagement metrics can be extremely beneficial to measure for content websites. Engagement and Success work hand and hand.
Bounce Rate %
Bounce Rate is the percentage of single-page visits (i.e. visits in which the person left your site from the entrance page without interacting with the page). Bounce Rate % is important to find out what pages have issues with driving users deeper into the site.
If you have a blog post or a page that has a Bounce Rate of above 30%, you may want to add a Call-To-Action or better navigation. This will encourage the user to navigate to other portions of your site!
New vs. Returning User %
This is pretty intuitive. It is the percentage of new users that are visiting your site compared to the percentage of returning users. This is really big for an ecommerce or a higher education website. You always want to be attracting as many new users as possible, while still keeping a core group of users.
After you understand the percentage of new vs returning visitors to your site, you are able to drill down and understand their actions.
- Who buys more?
- Who has a higher avg. session duration?
- What channel are they taking to visit the site?
These are all questions that you should be asking about your users. Understanding their behavior will help you set up your marketing campaigns. You will now be able to understand your users better then ever.
Funnel Conversion Rate
This topic is huge in the ecommerce world. Are you getting people on your site? Are you converting them into leads? Are you then converting them into sales?
- Sessions
- Lead Generation
- Ecommerce Conversion Rate
These three metrics will help you understand how well you are converting your visitors.
As a salesman or saleswoman the hardest thing to do is get that customer through the door. Once they are in the store, it is on you to create the lead, then close the deal and make the sale.
Top of the Funnel
Getting the user through the door. This is the hardest part of the Funnel conversion process. The key metric in this segment of the funnel is sessions. A session is a group of interactions that take place on your website within a given time frame. The more sessions you have, the more opportunities for sales. Once they have visited your site, you are able to segement them into channels to find which channel is most effective at driving traffic and sales. This becomes really helpful when you are deciding where to spend your ad dollars!
I am sure you know this already, but it can be very difficult to create traffic on your site. One helpful way is creating content. Hubspot put together a step-by-step process that I found really helpful.
Middle of the Funnel
You have now completed the hardest portion of the conversion process. You got the user through the door. Now that they are on your site, lead generation becomes your next goal. These micro conversions are really important to the Conversion process, as you need leads to have successful sales. Dowloading a whitepaper, signing up for a newsletter, registering for a webinar, or joining a mailing list are all great ways for your organization to create leads.
Once you have created your list of leads, you can move onto the bottom of the funnel.
Bottom of the Funnel
The number one way to know you are closing the deal is by your Ecommerce Conversion Rate. This the percentage of visits that resulted in a transaction. This is absolutely KEY to understand your conversion success. In the Middle of the Funnel, we had micro conversions. Now that we are at the bottom, we need to create macro conversions. These consist of purchases, creating accounts, subscriptions, and contact us forms.
Depending upon your industry, you are trying to sell different items. On an E-Commerce platform, the more purchases the better. For a magazine, the more subscriptions the better. For us at InfoTrust, we want people to contact us for our consulting services.
Conclusion
Hopefully, I’ve outlined a few key web analytics metrics for you to monitor. This can be a difficult process, so if you are still having trouble, we are always here to help!
