

I never thought I would start off a blog post with a quote from Ashton Kutcher, but it is 2016, so here goes nothing:
“In ecommerce, your prices have to be better because the consumer has to take a leap of faith in your product.” – Ashton Kutcher, actor, producer, investor
In many ways, Kutcher is completely correct. Unless you work for Amazon or eBay, chances are your eCommerce website is not a household brand. In order to establish your site, you’ll need to gain the trust of consumers. Low prices are a great starting point, but you should also ensure your security and payment seals are visible, offer promotions or free shipping, and that you’re running countless A/B tests to hone in on tactics that improve your conversion rate. Which brings us to #1 on our Top 5 Ecommerce Metrics for Dummies:
1) Conversion Rate
For this post, I’ll be focusing on utilizing the most popular analytics platform in the world: Google Analytics (GA). It’s  hard to find a metric in Google Analytics more valuable, and more important to your bottom line, than conversion rates. This metric is calculated in a very simple way, and assumes that you have eCommerce tracking set up. “Conversion Rate” is the number of transactions divided by the number of sessions, over the same time period.
In Google Analytics, you can look at your conversion rate across all goals, as well as your conversion rate for a single goal, by checking out the Conversions > Goals report. But for the purpose of eCommerce, the conversion rate we’re most focused on is the conversion rate in the Ecommerce > Overview report.
A/B testing different elements of your website is often the best way to improve your conversion rate. When the difference between a 10% and 15% conversion rate can be millions of dollars, you’ll thank me later.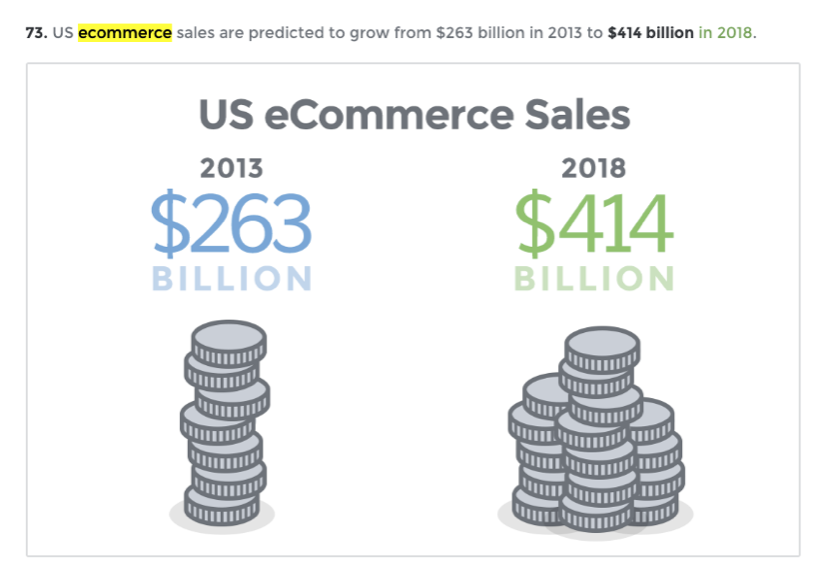
2) Average Order Value (AOV)
Sure, we could probably have named this blog post “The Top Ecommerce Metric in Google Analytics” and just wrote  about Conversion rate the entire time. It is, after all, absolutely paramount to your businesses success. However, there’s another metric that every eCommerce dummy needs to know: Average Order Value (AOV). AOV is a fairly self-explanatory metric: It’s the average size of an order on your site. If there have been 10 transactions in one day, and $400 revenue, your AOV is $40. AOV is automatically calculated in your Ecommerce > Overview report.
By monitoring your AOV trend over time, as well as your transaction conversion rates, you can determine how much revenue you can expect to generate from your current and projected traffic levels. And of course once you realize that more traffic equals more revenue, your traffic generation efforts will become a top priority. Speaking of which…
3) Cost of Acquiring Customer (CAC)
The cost of customer acquisition is simply the amount of money you have to spend to get one customer. No matter if you’re  focusing on SEO, social media, content creation, or paid advertising, they all cost money (some easier to quantify, such as paid ads, others still cost your business in company time, such as SEO, blogging and social media efforts). If you spend $1000 to get 20 users to buy something on your eCommerce store, your CAC is $50. Determining your internal CAC is not a metric easily found in GA, as it requires some internal number crunching. RevenueWire does a great job of explaining how to determine your internal CAC.
Put simply: You’re going to want to better understand which marketing efforts help to lower this undervalued, but very important, eCommerce metric.
4) Customer Lifetime Value (LTV)
So you’ve determined your CAC. Now what? You’ll want to begin discovering your customer’s lifetime value. How many users buy  a product once but never return? This is also referred to as your “Churn” rate. Churn is the percentage of customers who buy on your site but never come back. If 20 out of 100 customers are one-time users, your churn rate is 20%.
Lifetime value is a metric used to calculate the total amount of dollars spent by a given customer over the duration of their relationship with your eCommerce site. Since you’ve already determined your CAC, you’ll need your LTV to be significantly higher than your CAC to be profitable. And if this stat doesn’t open your eyes nothing will: eCommerce spending for new customers is on average $24.50, compared to $52.50 for repeat customers. (McKinsey)
In order to help lower churn and increase LTV, marketers often follow-up with emails (sometimes too many) as well as incentives for their customers to return. “Thank you loyal customer, here’s 10 free Ecommerce Bucks on us!”
5) Shopping Cart Abandonment
At this point you’re an expert in conversion rate optimization, you understand the importance of AOV, and you’re ready to begin comparing your CACs with LTVs (and, as a special bonus, you now know what all of those acronyms stand for!).
Now, let’s take a look at your checkout funnel, specifically focusing on shopping cart abandonment. In Google Analytics, your checkout funnel can be found in the Goals > Goal Flow report. If enhanced eCommerce has been set up (which it has by now, right?), this may quickly become your favorite report. If your conversion rate is low, CAC is high, and/or LTV isn’t where you’d hoped, then it’s time to dissect exactly where users are leaving your site.
The cart abandonment metric indicates the percentage of users who’ve added products to their cart but did not complete the checkout process. A user adding a product to their cart indicates intent to purchase, and leaving without buying means losing potential customers. Remarketing to get these users back to the site is great, but not ideal since it’s raising your CAC even higher. Try lowering cart abandonment through A/B testing, simplifying the checkout process or offering discounts. 54% of shoppers will purchase products left in shopping carts if those products are offered at a price lower than its original (eCommerce Survey 2014). Sounds like a no-brainer to me (as long as margins allow).
If you have any questions about the content of this post, any interest in working with InfoTrust, or just want to debate about Cincinnati sports with me, drop me an email at jimmy [at] infotrustllc.com
I’m not great at closing out blog posts, so I’ll leave you with another Ashton Kutcher quote:
“The goal is not to get into a relationship; the goal is to be in a relationship.”
….of course we’re going to assume Ashton is talking about our relationship with eCommerce sites. You tell ‘em, Ashton!