

‘Twas that time again, the Olympics were in full force and suddenly, your intense (yet often dormant) national pride was bursting. Though the Rio games were full of new surprises and feats, there was also a lot of the same ol’, same ol’ going on. Michael Phelps won a few golds, Usian Bolt crushed competitors – things that are expected- or at least very likely. The American fans were quite content knowing that if Michael Phelps was competing, a medal was forthcoming and of course, the Jamaicans have all the faith in their national hero.
Wouldn’t it be nice if digital marketing worked the same way? Always knowing, without a doubt, your top channels, efforts and campaigns will pull through? Well today, I’m going to tell you how you can get this confidence. Pssst: it all comes down to the data. Getting your web analytics systems set up properly can not only allow you to measure your efforts accurately, but also can give you a glimpse of what is yet to come.

Many organizations today use data, and it can come in all shapes and sizes. In terms of digital marketing, data can be acquisitional (like your marketing impressions, clicks, user sessions on your digital platforms, location of customers etc.) but also behavioral (like your user type – new vs returning, device used, bounce rate on your digital platforms, how many orders are completed and the list goes on). Data can also come from many sources – your advertising platforms and partners, your customer service and internal teams, and your website and/or mobile app directly via a web analytics tool.
With this plethora of data floating around, many organizations face challenges making sense of it all. There is an expression that defines a lot of companies today: “Paralysis by Analysis”. You may have all the fancy tools and products available, but sometimes less is more.
The true measure of whether a web analytics tool is working or not comes down to how the business actually uses web analytics and if they are data-driven. It’s like the old cliché: You can have a Ferrari of a tool, but you first need to know how to turn it on before driving it. So, to answer the question of if your web analytics tool is working for you or against you, we suggest reviewing this in 3 parts:
- Reviewing the landscape: What is actually used today?
- Assess the accuracy: Is tracking actually worth using?
- Drive: Action and simplicity, not just analysis.
Reviewing the landscape
Determining whether your web analytics tool is working for your organization or not starts with identifying what is your analytics tool. It sounds silly but often times, when we ask this question to various teams, the answers vary. The first step is to unify the measurement strategy in your organization so every person on your team, in your department, and within the company knows what measurement tools are available and reference the same technologies. Without standardization of usage, and commitment to driving a unified approach, your web analytics tool won’t work because it’s simply not used or is used poorly.

Though a painful process upfront, many organizations opt in to completely scrapping all previous, disparate technologies to migrate the organization to a totally new single setup that is shared and robust. The beauty with this approach is starting from scratch and with a fresh slate, you can dictate and ensure clean measurement from day one. Other organizations that have heavy reliance on core platforms opt to keep the existing tools but, in an effort to increase usage and ensure adoption, eliminate other superfluous technologies.
Depending on your organization, a cleanse of tools and data overload can actually encourage teams to be more data-driven.
Are you running an eCommerce site or platform (or several)? Here’s a quick link for top tools used by eCommerce sites in the industry today.
Assess the accuracy
Great, your organization is aligned on using one or a small subset of tools! But now the question comes: Should they use this tool or, rather, are we confident in what the tool is telling us about our customers, digital properties and business?
Analyzing on bad or incorrect data is arguably more damaging than analyzing on no data and just gut instinct. When we work with organizations that want to jump straight to gleaning insights from their web analytics tool, we often need to take a step back and review what exactly we are analyzing and if we trust the data. This is where an audit and assessment on the data collection and reporting is absolutely required. Since this is a topic very near and dear to our hearts (at least for Google Analytics), we’ve written several articles on the topic:
- Why do companies still have web analytics issues?
- Is My Google Analytics Data Accurate? Part 1
- Is My Google Analytics Data Accurate? Part 2
- How to ensure your GA data is accurate [Downloadable PDF]
To my previous point, many organizations decide to just overhaul their analytics and switch to a totally new platform to get the tracking set up right from the start. Though this can be a difficult undertaking at first, the benefits are a digital transformation within the organization to a unified and optimal tracking approach.
Drive: Action and simplicity, not just analysis
After analyzing and building reporting practices for over 4000 websites and 100 global regional teams, one gleaming theme has always remained consistent: Simple and direct action take-aways is the main missing component of web analytics platforms.
Even with a clean architecture for data collection, a single and robustly implemented web analytics tool, and a stellar team of analysis and data scientists reviewing the data, if there is no action taken from the data then there is no value in measurement at all. Often times, teams become easily lost with the complexities of building reports or finding nuggets of insights that can be actionable. This is where the concept of “less is more” really comes in. Finding insights and simple actions can be as easy as regularly looking at your top three campaigns vs three worst campaigns in terms of driving completed orders/revenue or conversion rate. Why are some campaigns better at converting users than others? What about our worst campaigns can be improved? You can use this approach of comparing top performers and worst performers for many efforts – landing pages/content, products purchased, marketing channels etc.
A really easy way to immediately show simple, actionable take-aways from data reports is to do a date-range comparison week-over-week or month-over-month for just one dimension/attribute and metric. For example, look at just changes in revenue month-over-month of your campaigns. Which campaigns had big increases/decreases in terms of just this one metric in this date range comparison? Why did this change happen, and can we do anything about it (meaning, if it was an increase, how do we do more of whatever we did and if it was a decrease, how do we revert what we did)?
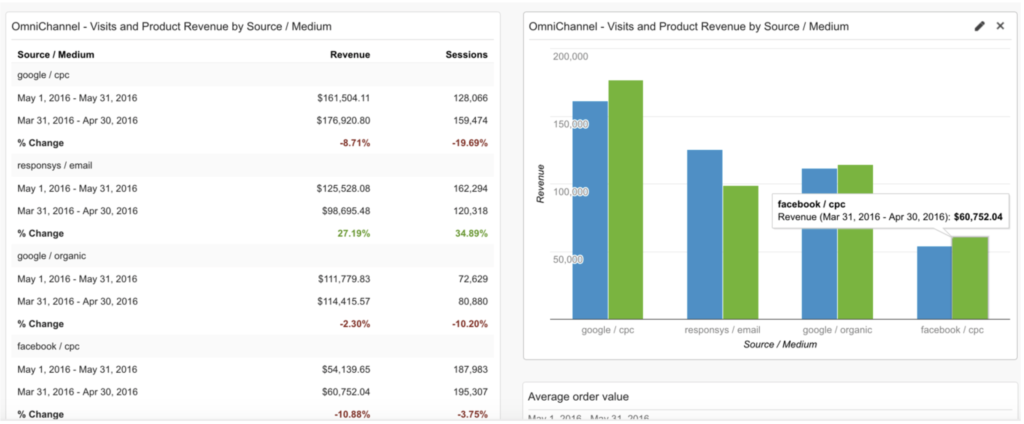
In Google Analytics, an example of simple and actionable data can come in the form of a monthly dashboard comparing various dimensions with only one or, at a maximum, two metrics at a time. See an example dashboard shown below that highlights changes month-over-month for top sources of traffic. Notice the increases in certain channels such as Email indicating those were successful last month, whereas other channels decrease. Perhaps the learning/action here is take whatever content or messaging that was used in email and apply it to Facebook or Google Adwords, as those channels dropped in overall revenue.
It may seem overly simple, but to get your web analytics tool working for you, you need to start small with your teams and build on successes of making incremental, yet valuable, changes gradually. Throughout time, you will start to better understand the things that are consistent and can guide your marketing strategy towards driving predictable results based on previous activity. And maybe with this knowledge and assurance of what will and will not work, you’ll have as big of a grin as Bolt did winning yet another Gold Medal.

Images from Reuters, gif from Giphy.