Every now and then I get a question about which statistical methodology is best for A/B testing, Bayesian or frequentist. And usually, as soon as I start getting into details about one methodology or the other, the subject is quickly changed. The following will be a brief, non-threatening explanation of how the methodologies differ for people who are curious but don’t necessarily want to become statisticians.
Let’s start with one simple concept. Essentially the primary difference between the two methodologies is how they define what probability expresses.
Frequentist Methodology
In a frequentist model, probability is the limit of the relative frequency of an event after many trials. In other words, this method calculates the probability that the experiment would have the same outcomes if you were to replicate the same conditions again. This model only uses data from the current experiment when evaluating outcomes.
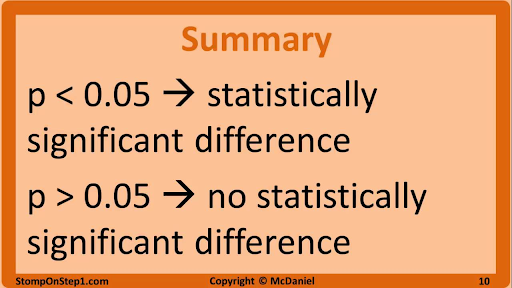
When applying frequentist statistics or using a tool that uses a frequentist model, you will likely hear the term p-value. A p-value is the calculated probability of obtaining an effect at least as extreme as the one in your sample data, assuming the truth of the null hypothesis. For example, a small p-value means that there is a small chance that your results could be completely random. A large p-value means that your results have a high probability of being random and not due to anything you did in the experiment. In short, remember that the smaller the p-value, the more statistically significant your results.

Unfortunately, people often misinterpret what p-value represents. P-value is essentially the probability of a false positive based on the data in the experiment. It does not tell you the probability of a specific event actually happening and it does not tell you the probability that a variant is better than the control. P-values are probability statements about the data sample not about the hypothesis itself. So if you ran an A/B test where the conversion rate of the variant was 10% higher than the conversion rate of the control, and this experiment had a p-value of 0.01 it would mean that the observed result is statistically significant.

Bayesian Methodology
Bayesian statistics are named after philosopher Thomas Bayes who believed that “probability is orderly opinion, and that inference from data is nothing other than the revision of such opinion in the light of relevant new information.” Updating your beliefs in light of new evidence? What a wonderful concept.

With Bayesian statistics, probability simply expresses a degree of belief in an event. This method is different from the frequentist methodology in a number of ways. One of the big differences is that probability actually expresses the chance of an event happening. Although the calculation can be extremely complex, this method seems to be a simpler and more intuitive approach for A/B testing. Quite simply, a Bayesian methodology will tell you the probability that a variant is better than an original or vice versa.
The Bayesian concept of probability is also more conditional. It uses prior and posterior knowledge as well as current experiment data to predict outcomes. Since life doesn’t happen in a vacuum, we often have to make assumptions when running experiments. But the Bayesian approach attempts to account for previous learnings and data that could influence the end results.
If you have a favorite statistical model, that’s awesome! If you don’t, there’s good news. You don’t really have to pick a side. At this point, many experimentation platforms are using proprietary, hybrid models that combine a traditional statistical model (Bayesian or frequentist) with some other technology such as machine learning. It certainly doesn’t hurt to have at least a basic understanding of the methodologies that analysts have gotten into heated debates about for years.
When it comes down to it, what really matters is how well you understand the results you are given in your experimentation platform of choice. This understanding leads to a more data-driven approach to assessing risk, how much your organization is willing to accept, and what the predicted improvement to business outcomes could be.
There are some analysts who get really passionate about debating the pros and cons of Bayesian and Frequentist statistical methodologies. But in the real world, you may have experimentation stakeholders from multiple departments simply wanting a decision, often with no regard for the statistical methodology used. Don’t let analysis paralysis keep you from running a successful experimentation strategy.
But just in case you get into a statistical methodology battle at a bar or in a boardroom, feel free to reference this quick summary. Hopefully, this has been a concise, easy to understand explanation and I kept my word that you can grasp it in 5 minutes.


