
Making the most of clients/prospects’ data is the driving force of the conversations we have on the Infotrust partnerships team. When I sit down and chat with organizations, I try to better understand their priorities and goals around data-driven marketing. Understanding our partner’s goals allows us to put together a roadmap to help advance their analytics maturity to drive more efficient and effective marketing.
The starting point in every conversation is finding out what Martech stack their company utilizes. The answer I typically receive is either “We’re an Adobe house” or “Google is our source of truth”. Many could argue that there’s a friendly rivalry between Adobe and Google, and fans that support one will typically support that same team for a lifetime. It has been conventional wisdom for many years that digital practitioners and enterprises pick one of these tools in an either/or mindset and then stick to that platform.
Well, you may be surprised to hear that this scenario isn’t the case anymore. Infotrust has witnessed the trend over the past couple of years of top enterprises utilizing both Adobe Analytics AND Google Analytics simultaneously. As both platforms are unique and beneficial in their own ways, I wanted to share where companies are seeing the value in running both solutions harmoniously.
To explain some of the key reasons why enterprises utilize both Adobe and Google, we have written two separate articles. In this previous article, we took a look at the needs from an overall business user perspective (a high-level overview of why enterprises use both). As the second article of the two, we will take a look at the needs from a technical user perspective and how analytics teams can benefit from a dual implementation.
1. Implementation and Customization of Analytics
A strong implementation is the bedrock of any digital practice. Every organization is going to have unique data points to collect about its users. Whether it’s a retailer trying to understand which of their products are the most popular sellers or a media outlet trying to comprehend how much of a video their users viewed, all companies have metrics they need to measure. Without a strong, trusted implementation and iteration capability, digital data at best fails to maximize its potential and at worst sees confidence in it erode.
Both Adobe Analytics and Google Analytics offer key dimensions (Browsers type, Country of origin, entry page) and metrics (Bounce rates, visits/sessions, page views ) “out of the box” i.e. with a basic implementation. Google Analytics is known for its ease of use, offering the ability to create and analyze 20 custom dimensions and/or metrics that are specific to the success of the team, such as tracking which day a customer subscribed to the site, the most traffic that came from a particular campaign, etc. An upgrade to GA360 allows for up to 200 custom dimensions/metrics.
Adobe Analytics is product-centric, meaning that its focus is to help bring attention to the products and services on your site. Adobe’s layout is similar to a giant whiteboard, where you are able to build and track whatever you want from the very beginning with as many custom dimensions as necessary. This is a benefit to many organizations who have specific criteria they measure their products/services with, which in turn, helps them determine the main drivers of their eCommerce growth. Due to how much customization can be done, it’s important to have team members who understand the initial implementation and on-going maintenance of the analytics structure to maintain its sustainability.
As it relates to implementation, our team has seen cases of partners utilizing one tag management system (Adobe or Google) to deploy both analytics platforms. We’ve also seen cases where some will use a single data layer or data object that feeds into both systems, making it easy to streamline data. Our team enjoys helping partners develop and implement a robust data layer and collection approach, so you can have a single site deployment feeding lots of information.
2. Customization of Reporting
Collecting the data may be the first step, but taking that data and turning it into actionable insights is what leads to success. Sharing insights with stakeholders from your customer data is what drives change and revenue growth, but it can be difficult to get the point across if looking at raw data. By creating reports within your analytics platform, you’re able to easily digest potentially thousands of data points and convert them into key action items.
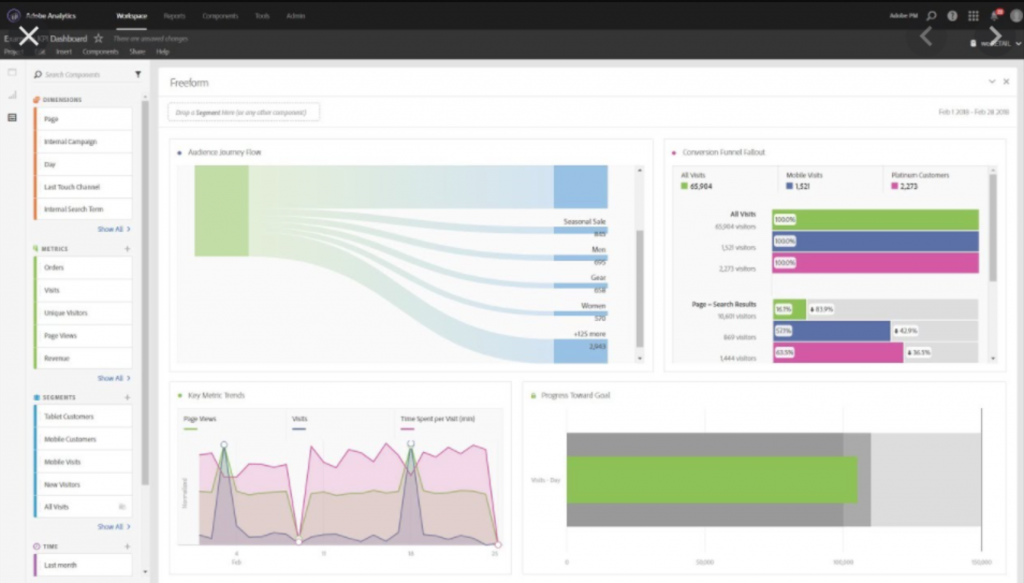
Adobe Analytics, besides having a structured reporting interface, has a freeform reporting feature called Analysis Workspace. Similar to the whiteboard layout mentioned above, this gives you the ability to drag and drop different tables, metrics, dimensions, and visualizations to create reports on a whim. Adobe does not have sampling and the architecture is already set up, which means you can track unlimited touchpoints and can scale the reports you create across different factors like products and channels.
This customization of reporting is the reason why one of Adobe’s core strengths is having the ability to solve complex business problems. Members of your team must know Adobe reporting to ensure you’re getting the most out of your platform due to the high amount of customization. There is no free “Adobe Academy” that will show you the ropes of how to leverage its power, so you must have the team with the right amount of knowledge. Additionally, due to the customization, it can take longer time periods for your reports to load.
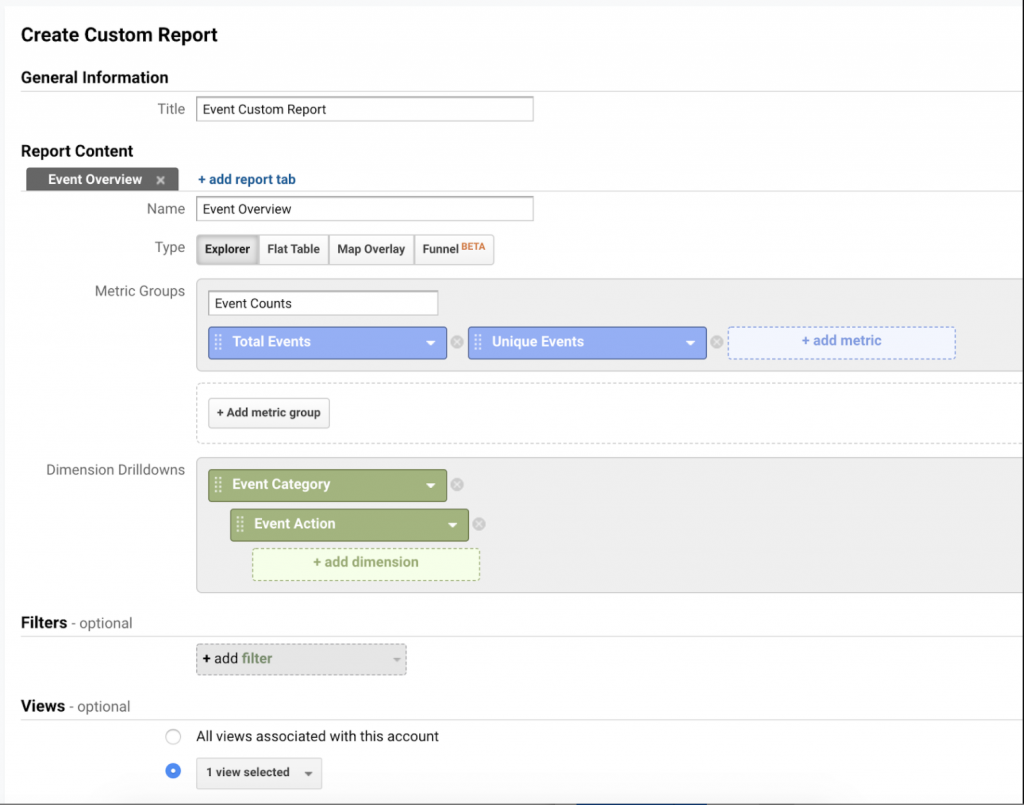
Similar to what I shared in the first section, Google Analytics has a structured reporting interface that makes it easy for teams to quickly utilize and drive value from. Organizations can simply pull up reports that contain information about customer acquisition, behavior, and conversion to better understand their consumers. There’s also an integration with Google’s data visualization platform, Data Studio, that helps expand Google’s custom reporting capabilities and converting the data into digestible dashboards. It’s important to note that Google Analytics reports are limited to 50 metrics per report. Unless you upgrade to GA360, you will start seeing sampled reports after 10 million hits have been collected for the month.
3. Audience Segmentation
The data that we’re collecting is a key factor that drives organizations to strategize campaigns, channels, and marketing budgets. If we can effectively build audiences and determine which is our highest valued group, we can then take resources to help reach out to the top tier group, thus helping to bring a higher return on ad spend and/or lower the cost of acquisition.
Audience segmentation is one of Google Analytics’ strengths and is a very quick process. After collecting information on your website, you can create numerous conditions to determine who your audiences are. Then, with Google Analytics’ (360) native integrations with its other marketing tools (i.e. Google Ads, D&V 360, Search Ads 360), you can share these audiences to utilize to implement winning campaigns. You can also export these audiences into BigQuery, Google’s data warehouse, where you can run data science models to predict future audience behaviors very quickly. One of my colleagues, Ariel Opelt, wrote a fantastic article on different techniques for building a winning remarketing audience that dives more into Google Analytics’ audience segmentation capabilities.
Adobe Analytics gives you the ability to create advanced audience segments, such as time-based pathing, that allows you to segment groups of consumers based on a series of interactions on your website. You can connect online and offline data to produce granular segments that will help you send the right message to the right group, and it also gives great self-serve user management, meaning you can see what everyone is doing with the data in Adobe. However, due to the customization of Adobe Analytics and no sampling, it can take a bit of time to gather info about your audience segments.
Conclusion
Google and Adobe’s analytics products (although created for the same reason) have key differences that help companies determine how they should be utilized to collect data. There are other disparities between the two that have not been mentioned, but this article gives an overview of the main technical use cases.
If you’re interested in running Google and Adobe simultaneously, there are a couple of action items you should consider. First, start asking questions amongst your team to understand what the purpose of utilizing both products is. Some questions that should be asked include:
- Do we have a roadmap for our marketing analytics team?
- What are our reporting needs for both products?
- Are we built for self-service reporting or ready for custom-built dashboards?
- What are the training and skillset needed to operate both platforms?
During this brainstorming session, you may realize that your organization doesn’t need to run both platforms. You can have a winning infrastructure implemented to collect the data needed from either Google or Adobe alone, but you will need to ask the question of which platform better suits your needs. You can use the same considerations shared above to walk you through the differences or watch one of our past webinars on the Key Differences Between Google Analytics 360 and Adobe Analytics.
Once you have started asking these questions and gathered answers, the next step would be to reach out to find the support your organization needs. If interested, you can reach out to our team at InfoTrust by clicking here to talk about your priorities and questions about Google and Adobe.