
Editor’s note:
On Oct. 14, 2020, Google announced that App + Web would be renamed Google Analytics 4, or GA4, and become the new standard tracking model across the Google Analytics platform. This announcement heralds in what is being deemed by many as “the future of analytics.”
It is nearly impossible to capture insights from your customer’s behavior if one person’s journey is split across the devices they have. It’s similarly difficult to measure customers across platforms when the platforms have entirely different measurement models and metrics. Google has been thinking about this and has cleared the way for a new measurement model in App + Web. The new measurement model is no longer just website and session centric, it’s customer, and as the name suggests you can unify reporting across your platforms. However, with this shift, it has become increasingly important to define and measure what matters.
Defining business-critical touchpoints with your customers in App + Web is important because reporting is sparse. It’s sparse in an exciting way, a way that allows you to define reporting to extract value from the tool. This isn’t to say that requirements gathering and implementation guides were not also crucial to the success of a Universal Analytics implementation; it’s just to say that it’s become even more important with the shift to App + Web. My colleague Mai has shared what this process looks like from a definition and implementation perspective. Google has also provided recommended events for your implementation based on industry, in case you would like a reference. Given this context, let’s explore some of the basics of the new reporting that will be available to you out of the box.
While some of the reporting looks familiar, you’ll find some new user-based engagement metrics and a few metrics like bounce rate that no longer exist. As someone who has spent the past ten years reminding marketers how a session or bounce rate is defined, I welcome a new challenge of explaining user-centric metrics. Below are a few definitions to start us off.
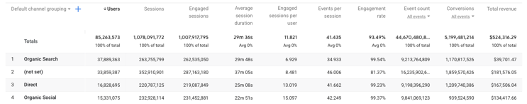
- Engaged Sessions – Number of sessions that lasted longer than 10 seconds, or had a conversion event or 2 or more screen views
- Engaged Sessions per User – Average number of engaged sessions per user. Calculation: engaged sessions / users
- Events per Session – The overall number of events triggered, divided by the number of sessions. Calculation: events / sessions
- Engagement Rate – Ratio of engaged sessions divided by the total number of sessions. Calculation: engaged sessions / total sessions
It’s also helpful to know that actions on your website are now measured with events, which have associated dimensions (parameters) and any event can be a conversion if you define it as such. The fact that there’s so much flexibility in how and what you track is why it’s even more important to plan ahead and document your implementation. The metrics above build off of each other but you can already start to see the shift from session reporting to the customer. Below are our metrics in a report for context… did I mention that bounce rate really isn’t a thing anymore?
Navigating reports have also gotten much more visual. The left navigation takes you to reporting that looks more like a dashboard than a list of individual reports.
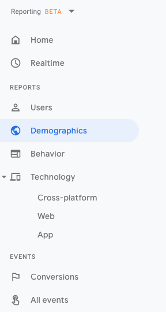
However, once you’re there you’ll navigate reports by clicking through to them.

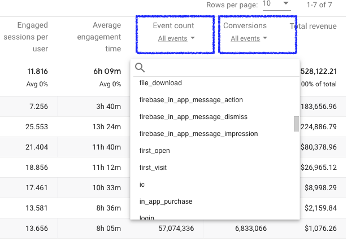
Once you have clicked into a report, you can customize it in a number of ways. First, you can add in new dimensions by clicking on the plus sign next to your existing dimension.
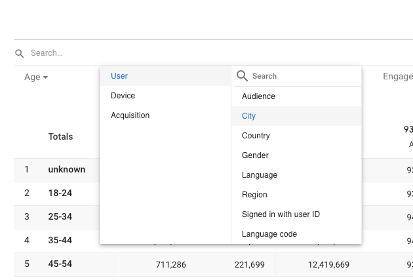
Adding in metrics is similarly easy; they can be added by navigating the event and conversion metrics.
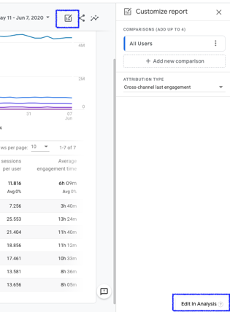
You can add in audiences (segments) and adjust some report settings with the customize report menu, however you can see that the interface is calling for you to complete your reporting in Analysis.
Some analysts will spend time in the out of the box reports, but the real power of the new reporting platform is that Google has built upon the Analysis reporting available in Universal Analytics – with additions like path analysis, user explorer and cohort analysis. What are these new features you may ask? In this post, I will provide an introduction and in subsequent posts, we’ll dive more deeply into the features.
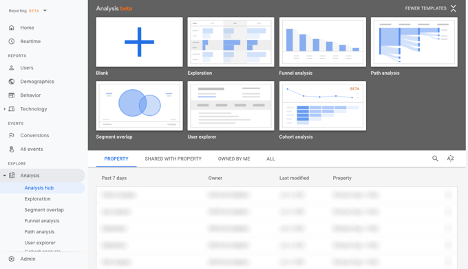
Analysis Hub
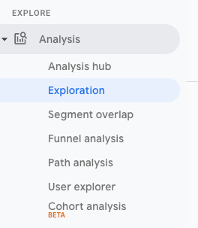
Analysis Hub is similar to the analysis home screen in UA except you can navigate to existing reporting or follow the analysis types into creating your next report. There are six types of analysis you can perform.
Exploration
This is built for doing ad-hoc analysis with options for multiple tabs and visualizations and is fairly intuitive for adding in segments, dimensions, and metrics. It’s also a time saver if you’re used to creating ad-hoc reports in UA for the simple fact that there’s an undo or redo button and you can easily duplicate tabs.
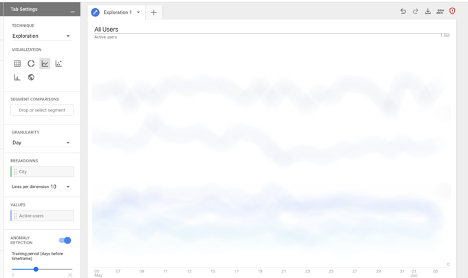
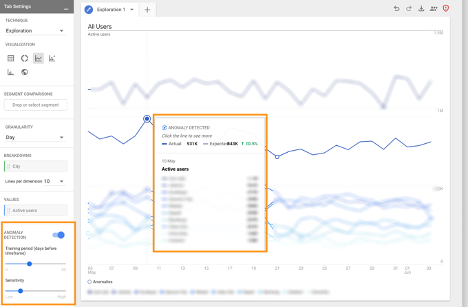
One of the killer new features is anomaly detection, where Google uses statistical analysis to identify ‘outliers’ with the ability to adjust the training period and sensitivity – add in some business context and you’re well on your way to knocking out that analysis.
Cohort Analysis
A more robust version of cohort analysis is available in App + Web which allows you to analyze a cohort of customers over time.
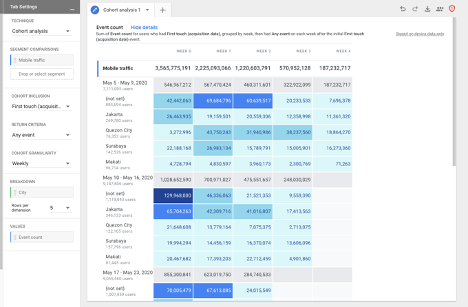
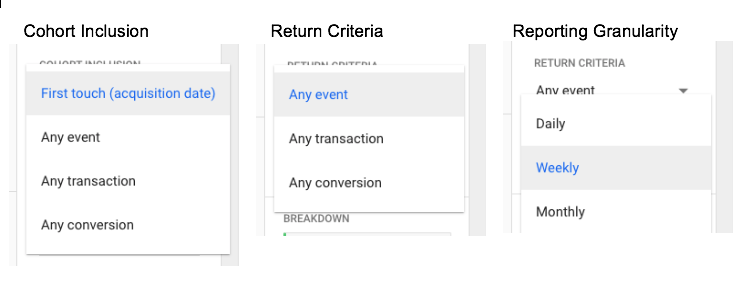
You now have the ability to adjust cohort inclusion, return criteria, and the granularity of reporting. Having the flexibility to be more specific in your cohort definition will lead to richer analysis.
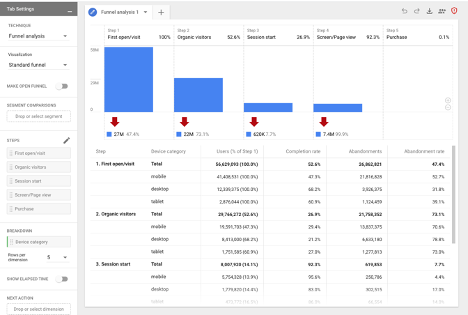
Funnel Analysis
Funnel analysis is pretty much exactly the same as what’s available in UA with the option to define ten funnel steps, which can be anything you like and measure how your customers navigate these steps.
Segment Overlap
Overlap reporting also hasn’t changed much but has become more powerful with the ability to measure across your platforms.

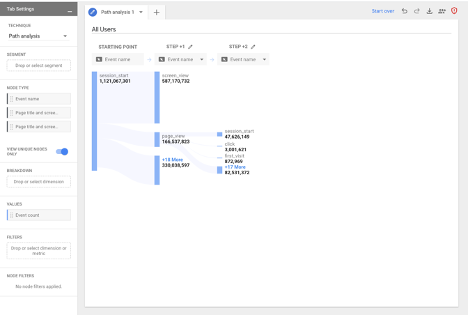
Path Analysis
Perhaps the most anticipated new reporting will be path analysis. This analysis will allow you to define specific customer touchpoints and see what pages or events your customers completed after that single point. To be clear though, there are three different dimensions ‘nodes’ for reporting: event name, page title and screen class, and lastly page title and screen name.
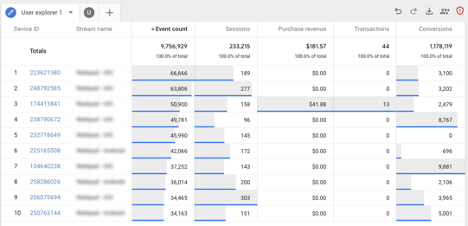
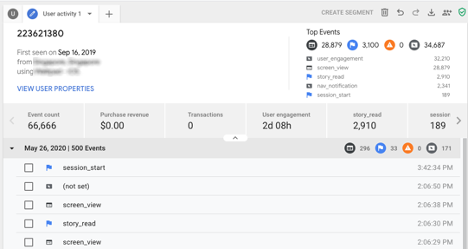
User Explorer
This is the user explorer reporting I always wish existed. If you have had to create custom reports to look up users based on their activity and then plug that ID into a User Explorer report in UA to explore a customer’s session, you’ll see in A+W Google is saving us this step. Initially, you can build a report of IDs and metrics and then click into each user’s behavior to better understand what is happening. This reporting will save a ton of time!
The above reports provide analysts with plenty of new ways to add value to the data collected. One event may be the first step of a funnel in the pathing report, and at the same time, used to define a cohort. With this new collection of analysis options, the analyst is empowered to uncover insights and behaviors by applying business logic at the user level in a new way. I hope you have enjoyed my brief introduction to App + Web, stay tuned for deeper dives into reporting!