What Are Custom Insights?
Google Analytics 4 (GA4) offers Custom Insights to detect changes in your data that are important to your team specifically. If the conditions set up in your Custom Insight are met, the insights will populate in the Insights Dashboard.
Some additional considerations and capabilities include:
- Optional ability to set up email alerts to get updates directly to your inbox
- Capacity to set up to 50 Custom Insights per property
- Flexibility in creating and deleting Custom Insights as your business needs change
- Easy-to-use Automated Insights are available in GA4 properties
- These are triggered when Analytics Intelligence detects unusual changes in your data and will notify you automatically in the Insights Dashboard
How to Create a Custom Insight in GA4
From the Reports Snapshot Homepage, scroll down to the ‘Insights and Recommendations’ section and select ‘View all Insights’.

In the top right, click ‘Create’.

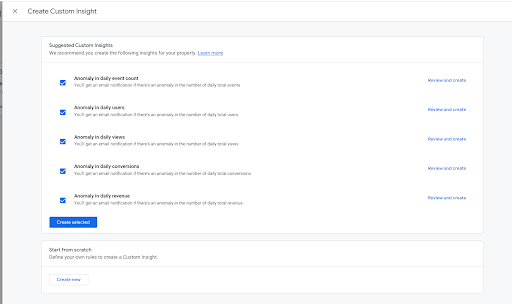
Suggested Insights will be at the top, followed by Start from Scratch Insights. Select ‘Create New’ and fill in details accordingly.

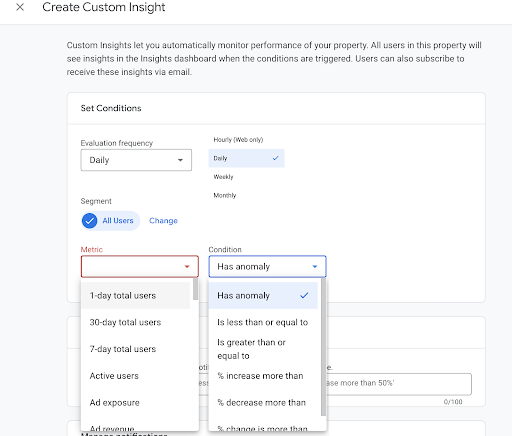
Select your Custom Insight Conditions, including:
- Frequency choices: Hourly (Web only), Daily (default), Weekly, and Monthly
- Segment: All Users (Default) or change to Create a New Segment (example: Sessions on a Mobile Device Only)
- Choose an available standard metric to track
- Set a Condition; if you choose a Condition besides Anomaly, you will be asked to fill out the Value portion that acts as the gauge for the Insight (example: % increase more than 5%)
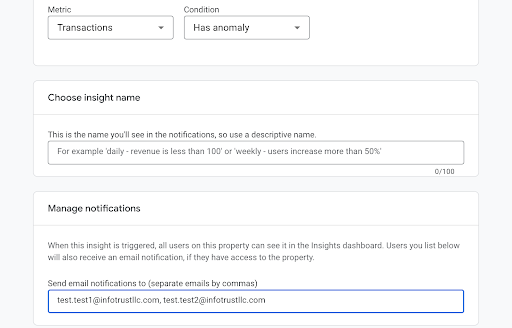
- Choose a specific and descriptive Insight Name
- Manage Notifications, which allows you to receive email notifications when this Custom Insight is flagged. You can also add other team members’ emails if they need notifications, too.


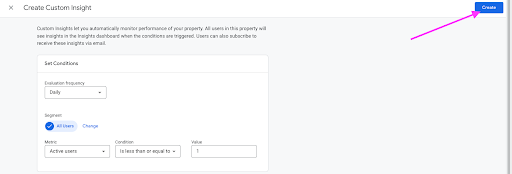
Click ‘Create’ to save your Custom Insight.

Examples of Basic Custom Insights
Time-bound fluctuations in conversions
For example: Daily conversions or transactions = 0 can help monitor issues with your e-commerce tracking or key insights such as account sign-ups
% changes in revenue
For example: Weekly gross purchase revenue % change is more than 25% compared to previous week; this custom insight can highlight unexpected revenue fluctuations in GA4
Site active users change
For example: Daily active users less than or equal to 0 can help GA4 users proactively monitor data loss
User engagement anomaly
For example: User engagement anomalies could indicate UX issues on the site from a recent code release causing users to bounce from the site


