
As an analyst at InfoTrust, a partner once asked for help building customer profiles using data from Google Analytics. They needed help with defining these profiles in a structured way that makes sense.
Google Analytics is a very powerful tool with lots of features for advanced analysis, such as table filtration and advanced segments (to mention a few). So, the question here is:
“How can we build custom profiles from Google Analytics using well-known techniques from the outside world?”
In researching this topic, I stumbled upon some other customer-profile-related articles and journals, particularly related to the recency-frequency-monetary (RFM) approach to customer profiling.
For those unfamiliar with customer profiling, it is a technique in digital marketing used to group customers based on some common attributes. This gives more focus when understanding the interests of your users. Combining customer profiling with Google Analytics segmentation techniques takes your data analysis to the next level.
Segmentation is a technique in Google Analytics that allows an analyst to isolate a specific type of data in their report. Segmentation is quite powerful, and if used correctly, advertisers can:
- Remarket to customers
- Build audiences
- Perform deep-dive analysis
- And much more
By following the steps in this article, you will be able to use Google Analytics data and the RFM approach to identify and act on customer profiles in Google Analytics. This is a quick-win method that can ultimately save you money and may require little-to-no help from your data science team to implement.
What is RFM, Again?
RFM is a technique used in marketing to group your customers by their commercial behavior. With this grouping, you can determine the type of marketing messaging that should be served to each group. A well-defined customer profile that is “actioned on” can boost sales and reduce churn for your business.
There are many tools and personnel options out there that can help you with this particular exercise, but if you are operating on a budget, all you really need is a team to help cluster your customers into RFM. If this is not possible, there are some great resources you can turn to help with the legwork.
For the examples in this post, I have applied a very similar technique I learned from an article from Analytical Marketer that goes into detail about applying these techniques. They created a nice RFM cluster that you can reference and use for your own business; this is a very simple example to show the concepts for using this technique with Google Analytics.
[Note: Before getting started, it’s important to note that your analytics platform (Google Analytics) should be storing user id or client id as a custom dimension. This is very important in attributing which customer falls into a specific segment.]
The process for this analysis involves the following steps:
- Define your ideal customer profile.
- Extract the metrics from GA to an Excel Sheet.
- Use the RFM technique to rank your customers into different profile groups.
- Cluster the RFM Segments that you have created.
- Optional – Define these customer profiles as a new User Scoped Dimension in Google Analytics. These dimensions can now be used as segments.
Step 1 – Define Your Ideal Customer Profile
This would usually be a business decision, and it can take as long as several weeks or as little as a few hours, depending on the complexity of your business. Let’s say we want to build just a few customers profiles and define them as below:
- High-Value (HV): These are the customers that are very loyal to you and generate massive revenue for your business. They patronize you a lot and you want to always keep them happy.
- Mid-Value (MV): These are your core customers who keep your business running with their fairly regular visits. They do not generate as much revenue as your HV customers.
- Low-Value (LV): These customers have little or no impact on your business during the period in review, but they might have potential.
Step 2 – Extract the Metrics from Google Analytics to an Excel Sheet
For this example, we will be extracting data from Google Analytics and using the date range of Sept. 29 – Oct. 5, 2020.
Note: Ideally, you would want to use data from a much longer date range, maybe 6 months or a year.
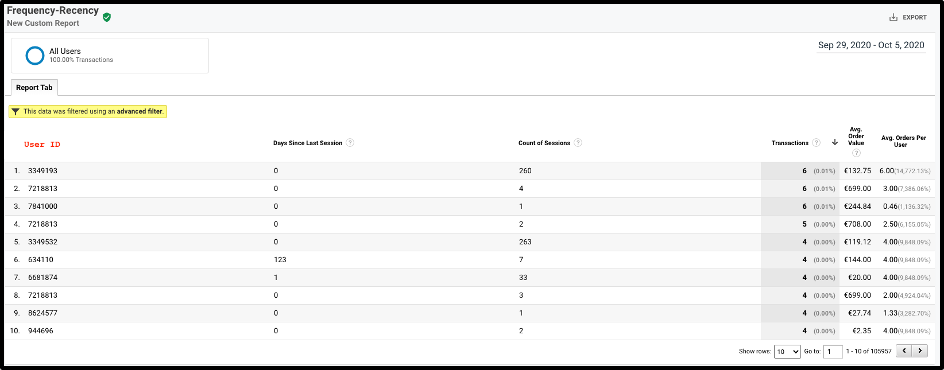
Create a Custom Report
- [Note Again: You might need to create an unsampled report (360 only) if you have a lot of data, or you may need to extract this data multiple times.]
- Navigate to Customization > Custom Reports > + New Custom Report
- Create the report similar to the screenshot below and remove user ids that are
- Extract the data to a CSV
- Note: The transactions and average order per user metrics were not used for this example.
- For Google Analytics, the metrics would be:
- User ID/Client ID: Needs to be tracked and stored in a custom dimension
- Recency: Days since last session
- Frequency: Count of sessions
- Monetary: Average order value
Step 3: Use the RFM Technique to Rank Your Customers into Different Profile Groups
Once you have your data, you are ready to start profiling your customers. We will be applying the techniques from the Analytics Market to clean up our data in Excel.
3.1 Create Additional Columns for the Recency and Frequency Ranking
Now, we will prepare this data to create a ranking that would eventually help us get our customer profiles. To do this:
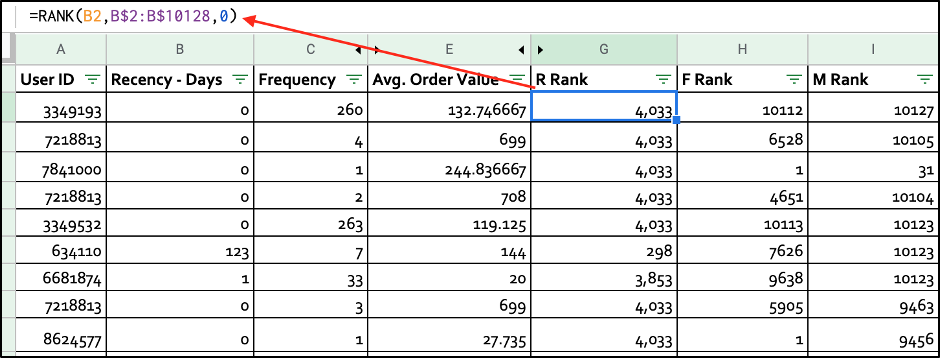
- Create two additional columns and name them R (Recency) Rank, and F (Frequency) Rank and M (Monetary) Rank.
- Rank from highest to lowest using the default ranking formula in Excel:
- For the R Rank Column:
- Since lower recency value is much preferred, rank the Days Since Last Session from ascending order
- For the F Rank Column:
- Since a higher frequency value is much preferred, rank the Count of Sessions metric from descending order.
- Note: You can also use Transactions as the frequency metric. This is commonly used for this sort of analysis.
- Since a higher frequency value is much preferred, rank the Count of Sessions metric from descending order.
- For the M Rank Column:
- Since a higher recency value is much preferred, rank the Order value from Descending Order
- From the screenshot, you will notice that the ranking makes sense. For example, a recency of 0 and a Frequency of 1 would have a higher and lower rank respectively.
- For the R Rank Column:
3.2 Create a Percentile Based on the “R Rank”, “F Rank”, and “M Rank” Column for 3 Customer Profiles.
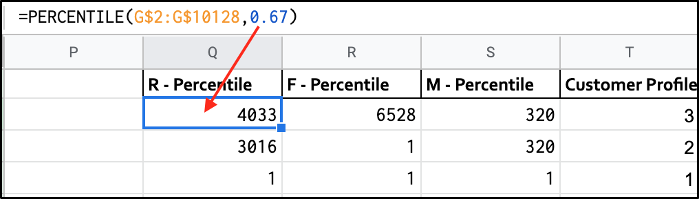
- Create three (3) new columns anywhere on your sheet and name them “R- Percentile”, “F Percentile” and “M-Percentile” (You can name them whatever you’d like).
- Create another column and name it “Customer Profile Score Template”.
- Each row will be from 1 – 3 in descending order. These numbers are from the RFM Segment we built early on in Step 2.
- Use Excel’s built-in formula to calculate the percentile for those three values.
- Since we have a rating of 1-3, we use 3 percentiles (33%).
- For example, the “R- Percentile”, “F Percentile” and “M-Percentile” for “R”, “F” and “M Rank” respectively would be:
- =PERCENTILE(Cell Range, Percentile) and so on
- Repeat the process for the remaining rows until you get your final value.
[Quick note before we proceed: The choice of percentiles to adopt for this task depends on your customer base. For example, if you know that you have low engagement customers that should be grouped together, you might want to use 20% or 50%.]
3.3 Use the Percentiles to Define Your Recency, Frequency, and Monetary Segments
Using the Percentile, Rank the “R Rank”, “F Rank” and “M Rank” from 1-3. The resulting values should be placed in a new column “R” , “F” and “M” respectively (Or whatever you choose to name them).
- The logic to this calculation would be if the “R Rank” is greater than or equal to the threshold (percentile) of the RFM Matrix and assign it the respective score.
- The formula I have used is this =if(G2>=Q$2,$T$2,if(G2>=Q$3,$T$3,$T$4))
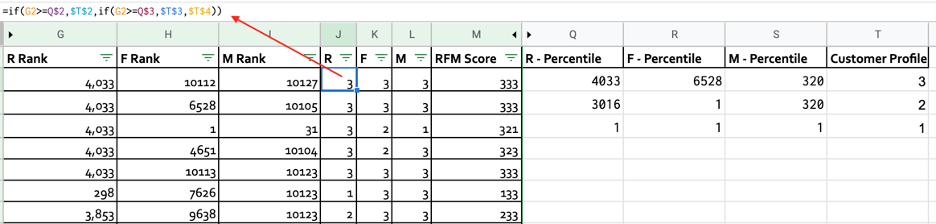
- You will notice from the screenshot above that I have concatenated Columns J,K and L to produce the results in “Column M”. Taking a distinct count of the RFM score produces the table below. Now you can see how many of your customers fall into any of the different combinations.

I also want to point out that you could have other segments or possible combinations. In our case, other segments were not relevant for this mini analysis.
Step 4 – Cluster the RFM Segments You Have Created, and Draft Action Plans for Each Cluster
Now that we have the parameters from our data source, we can now attribute them to the RFM cluster.
There are a lot of tools and personnel out there that can help you with this particular exercise, but if you are running on a budget, all you need is your best teammates to help you cluster your customers into RFM. If this is not possible, there are some great resources that have already been created that you might be able to use, such as this one from Analytical Marketer.
4.1 Cluster the RFM Segments
Ideally, this process of defining the RFM cluster can take more time to complete. The clusters can become complex depending on your business use case. I recommend using a small cluster (between 5 – 10) to make it easy to manage at first. In fact, you can use a clustering algorithm to create the RFM clusters using the raw data that we extracted from GA for Recency, Frequency, and Average order size.
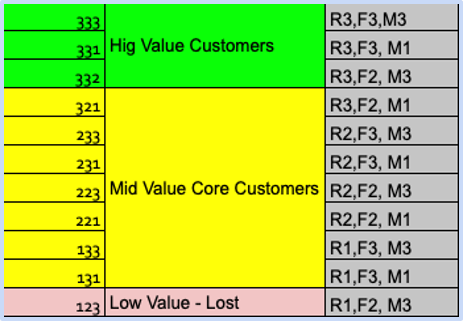
For illustrative purposes, we are going to use 3 clusters (not ideal) for our example, to represent the High, Medium and Low Value (HV, MV, and LV) customers we defined in Step 1. Let’s assume that our team has created this amazing way to cluster our customers below:
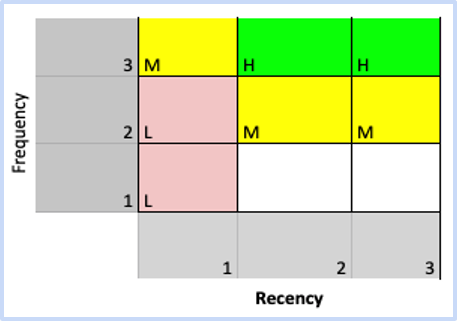
[Note: You might notice that I have used frequency and recency to group these customers. This is simply the case that I chose for this example. A more ideal case would be to use the monetary and recency values, especially if you are running an eCommerce business where it is more relevant.]
4.2 Create an Action Plan for Each Customer Profile
Using the above cluster, we can draft out action items for our customers. For example, you might want to initiate a loyalty program to appreciate some of these customers who are in your HV cluster.
Secondly, I would advise you not to ignore your LV customers. My suggestion is to strategically choose your marketing (i.e. less expensive campaigns) so that you do not lose money on them. As well, you may consider choosing certain items that you are able to offer discounts on, remarket to them, and hopefully, they might come back to shop on your website.
What Next?
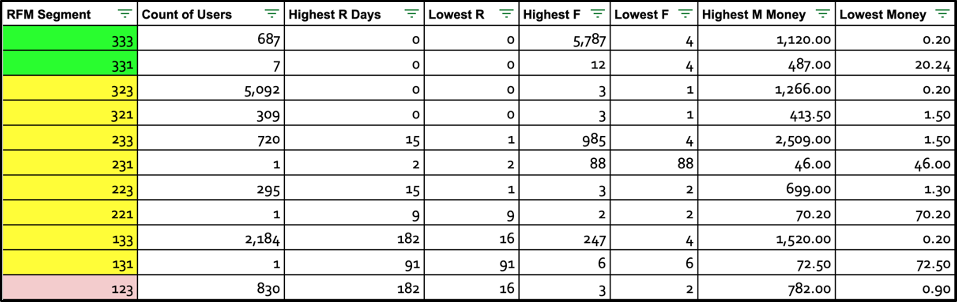
What we have done is sufficient, we can now identify and cluster our customers. But let’s take it one step further. There is an optional step of using these clusters to create segments in Google Analytics to further analyze the data. For example, I can determine the max and min values for Recency, Frequency and Monetary value for each cluster like so:
Now there is an opportunity to define segments from these values, using the Days Since Last Session, Count of Session, and Avg. Order Value (Not available when building segments). I would advise against this because building these sorts of segments would require some fairly complex logic that can be confusing. This brings us to the final, but optional, step.
Step 5 – Define These Customer Profiles as a New User Scoped Dimension in Google Analytics
I recommend creating a new custom dimension that helps you calculate the RFM profile for each customer. These custom dimensions can now be used to build segments for further analysis. In fact, you can build more complex segments by asking questions like:
- Do I have more males than females in my HV customer profile?
- What devices do my MV customers prefer to visit my site with?
- What locations do my LV customers come from?
Conclusion
We have shown how to cut some cost in a heavy data science project by using the RFM techniques in Google Analytics data to build rich customer profiles.
We extracted the data from Google Analytics into an Excel sheet, cleaned the data, and applied some built-in Excel formulas, such as ranking and percentiles, to segment our users based on RFM. Finally, we arrived at the total amount of users that would fall into these segments.
This should not be a substitute for statistical analysis as this process has some glaring limitations which you must consider. Some of these limitations include:
- This technique ignores other contributing factors that might affect the statistical significance of the RFM profiles
- Since this is a manual approach, we have not applied any data science models to our results
- RFM customer segmentation should be a continuous and iterative process – manually doing this technique can be time-consuming and prone to errors
- This approach is difficult when attempting to define segments from the results in Google Analytics
The best approach would be to capture this data from the onset by using a custom dimension in Google Analytics. You can feed the historical data into BigQuery, where you can extract and create statistical modules, then feed the results back into Google Analytics as custom dimensions.