
What are people doing? A question asked by many, for many different reasons, in various situations. As a digital professional (marketing, analyst, experience, etc.) you’ll ask yourself this very question about users on your digital platforms on a regular basis.
More specifically, you might ask yourself:
- What is generally the first thing users do on my app/site? Where do they go next?
- For marketing initiatives, if you created a new landing page,
- Did users follow the expected/ideal journey from the landing page to conversion?
- If the ideal journey was not followed …
- … then, where did users diverge/abandon?
- … for the users that converted, what was the actual journey to conversion?
- If the ideal journey was not followed …
- Did users follow the expected/ideal journey from the landing page to conversion?
- For digital experience optimization, the goal is that users get to their end point in three clicks:
- Did users convert after three clicks?
- Are users circling back to previous pages, before they find what they are looking for?
If you are asking any of the questions above, and you’re collecting data in Google Analytics 4 (GA4), then you’re in luck! You can use Exploration reports to better understand user pathways.
What are Exploration Reports?
Exploration reports allow you to gain deeper insights about your users and their behaviors by using a collection of advanced techniques that go beyond standard reports.
To explore GA4 data in more detail, you can use explorations to:
- quickly perform ad hoc queries
- easily configure and switch between techniques (see list of techniques in the next section – Exploration advanced techniques/templates)
- sort, refactor, and drill down into the data
- focus on the most relevant data by using filters and segments
- create segments and audiences
- share your explorations with other users of the same Google Analytics property
- export the exploration data for use in other tools
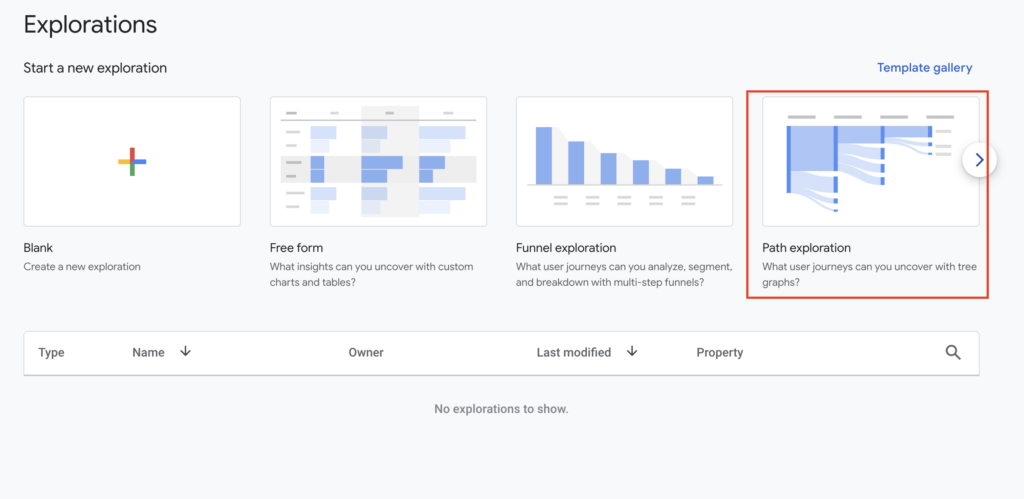
Exploration advanced techniques/templates are:
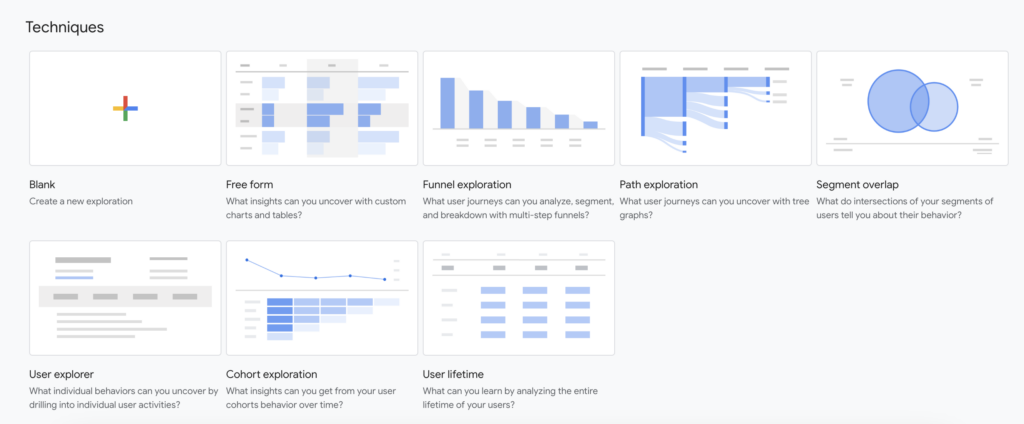
All of the Exploration report templates (screenshot above) can be used to better understand user behavior, but path exploration will allow you to dive in and visualize the paths your users take as they interact with your website and app to gain further insight into user pathways.
What is path exploration?
Path exploration uses a tree graph to illustrate the event stream, the collection of events users triggered, and the screens they viewed.

Quick overview
Starting/Ending point: Path exploration reports can have either a starting point or an ending point, but not both.
- Starting point (leftmost column) – the point where the tree graph/path begins and is built out from
- Ending point (rightmost column) – the point where the path ends
Nodes:
- Node Types – dimension values you’ll see in each step of the graph; currently, you can choose Event name or Screen name only
- Nodes – the data points within steps
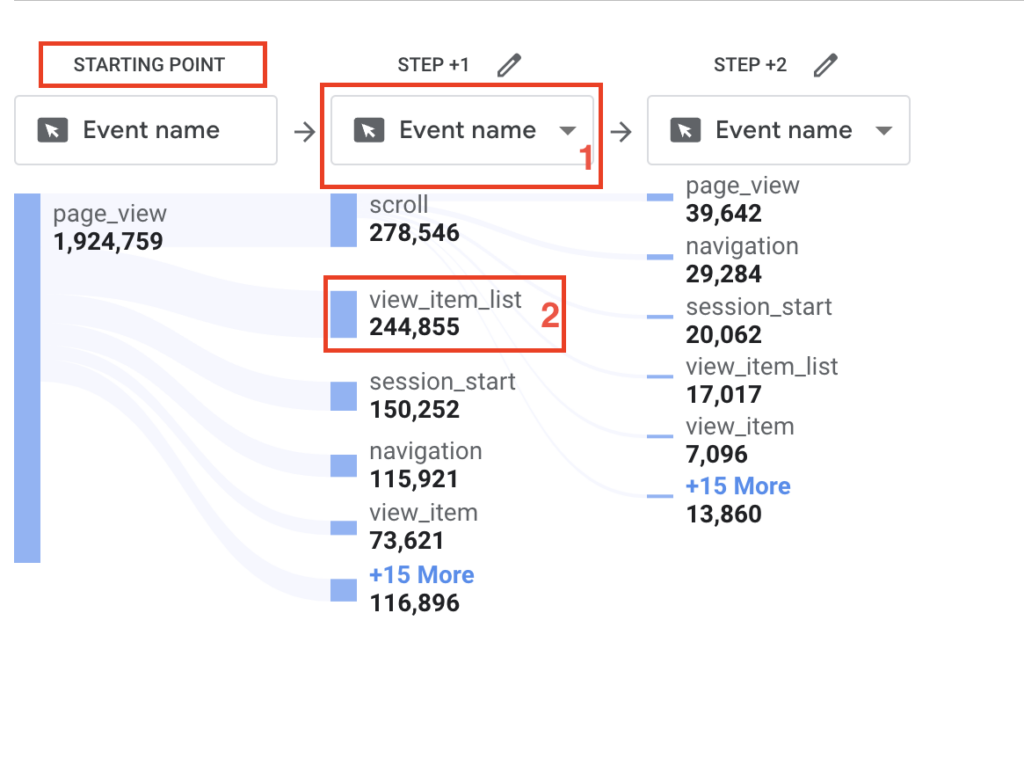
By default, path exploration reports display:
- users working forward, analyzing next steps (has a starting point)
- the top five nodes in each step; you can click + More to add up to 20 nodes per step; anything beyond the top 20 are grouped into an “Others” node
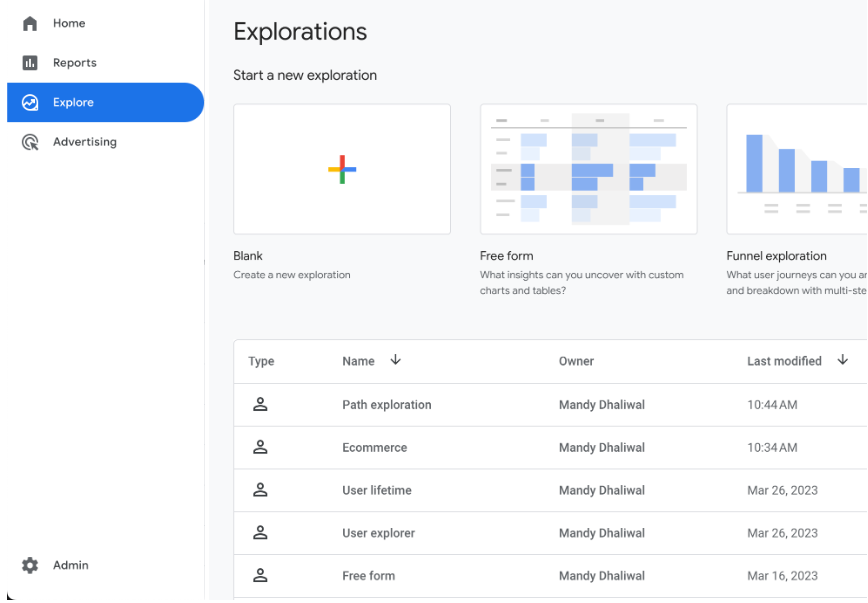
How to create a Path exploration report
- Within the GA4 user interface, navigate to the Explore section
- At the top of the screen, all the Explore templates can be found; select the Path exploration template
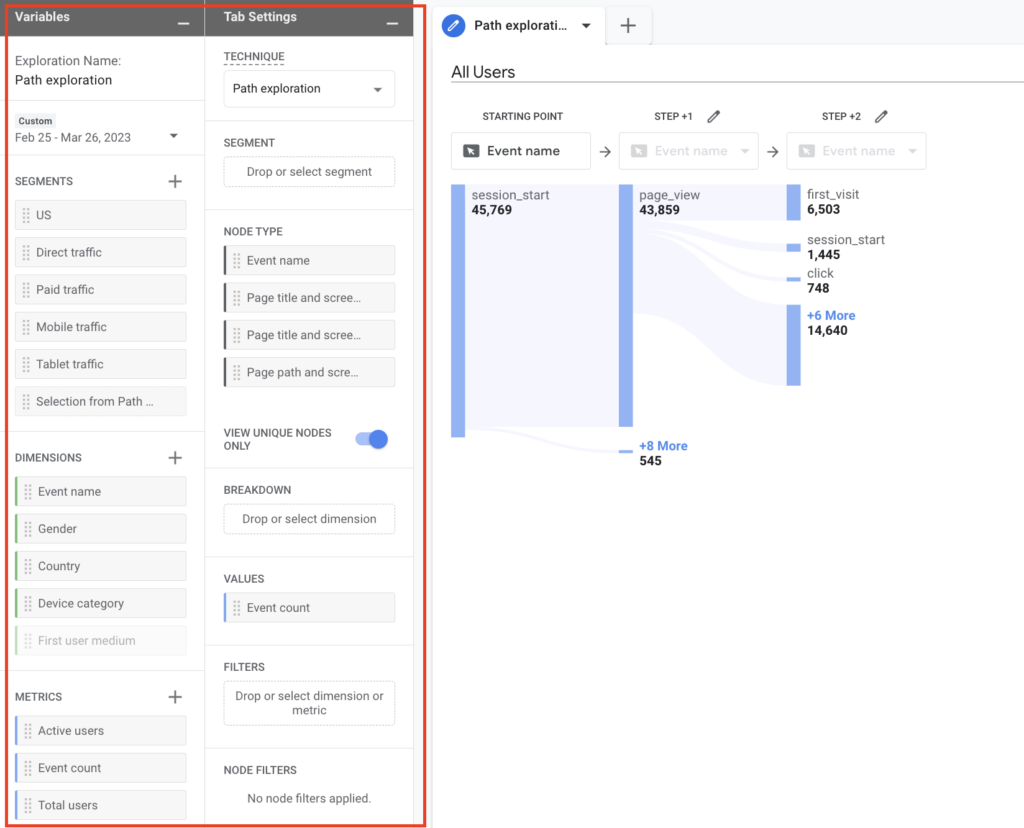
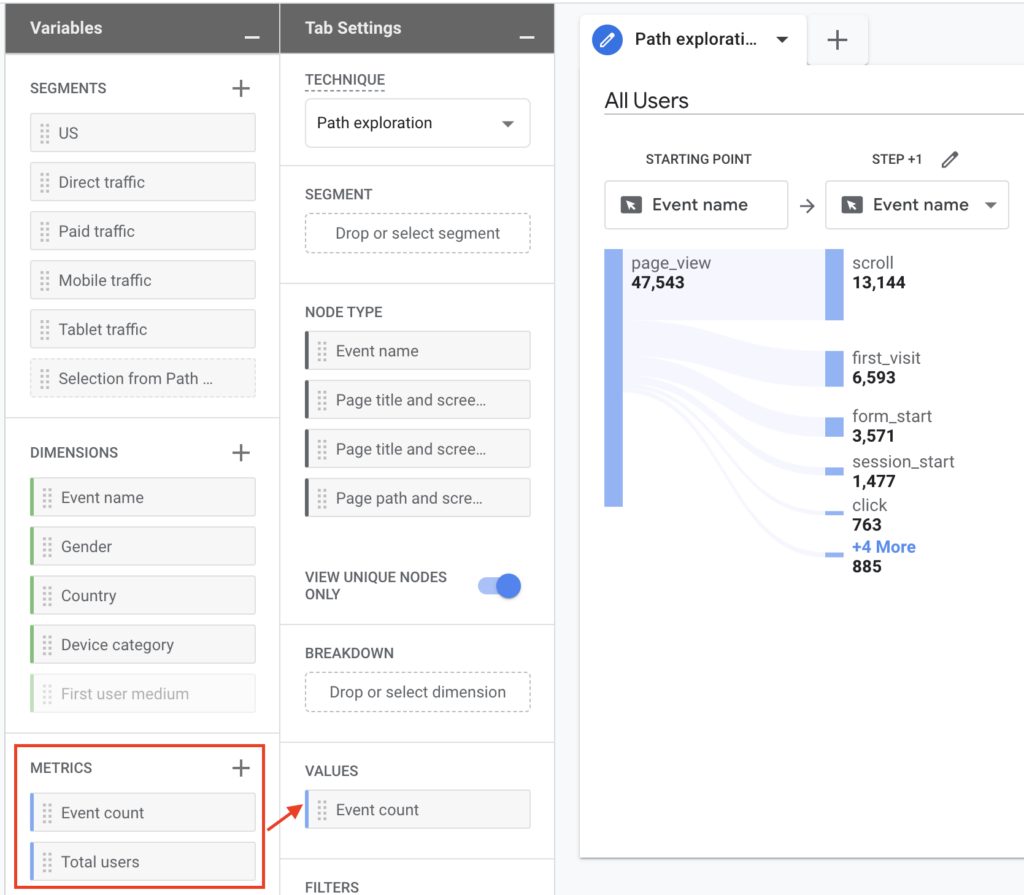
3. Select the relevant data required for your analysis
- Similar to other Explore reports, add segments, dimension, and metrics required by clicking on + next to the headings under the Variable & Tab Settings panels
- Note, currently, you can choose Event name or Screen name node types
Exploring User Pathways – Next Steps
As mentioned above, by default, path exploitation reports display users moving forward, to allow you to analyze the user’s next steps. To analyze next steps, you can complete the following actions within the report:
- Click on a node to expand it and add a new step
- Click the node again to collapse it
Note, nodes that appear in gray cannot be expanded as there is no next step (at the end of the user’s path).
Explore User Pathways – Previous Steps
To assess previous steps, the path Exploration report will need to be configured with an ending point (backwards user pathing). Backwards user pathing will allow you to assess the path users took to reach a specific event (for example purchase or conversion) or page/screen, and the different way users can navigate to that end point.
To create a backwards user path:
- Click on Start over at the upper-right corner of the report.
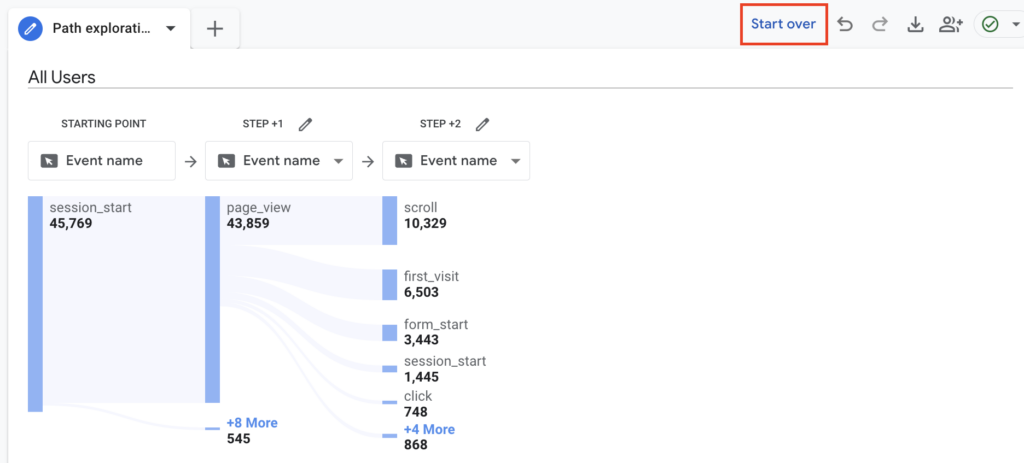
2. Either click on ENDING POINT and select the node that ends the path OR drag and drop the select node type from the Tab Settings panel on the left.

To analyze the previous steps, you can use the actions outlined above under Exploring User Pathways – Next Steps.
Additional Customizations
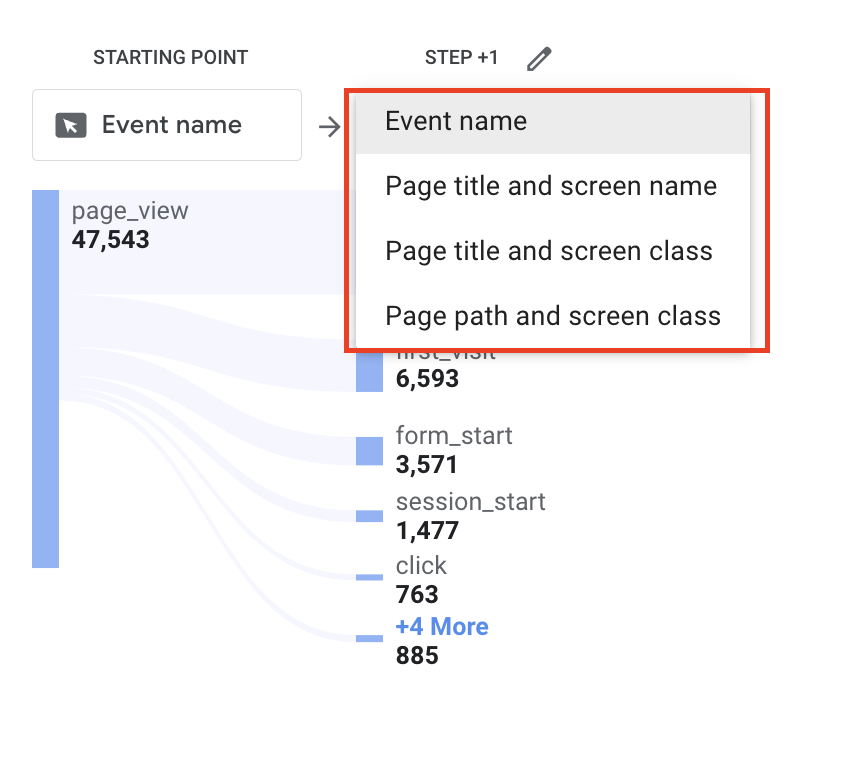
To further customize your user pathways analysis, you can do the following:
- Change the type of data shown in each step by selecting a different node type from the drop down
- Change the exploration metric
- Drag and drop a supported metric from the Variables column into the Tab Settings -> Values
- Supported metrics:
- Event count (default used)
- Total Users
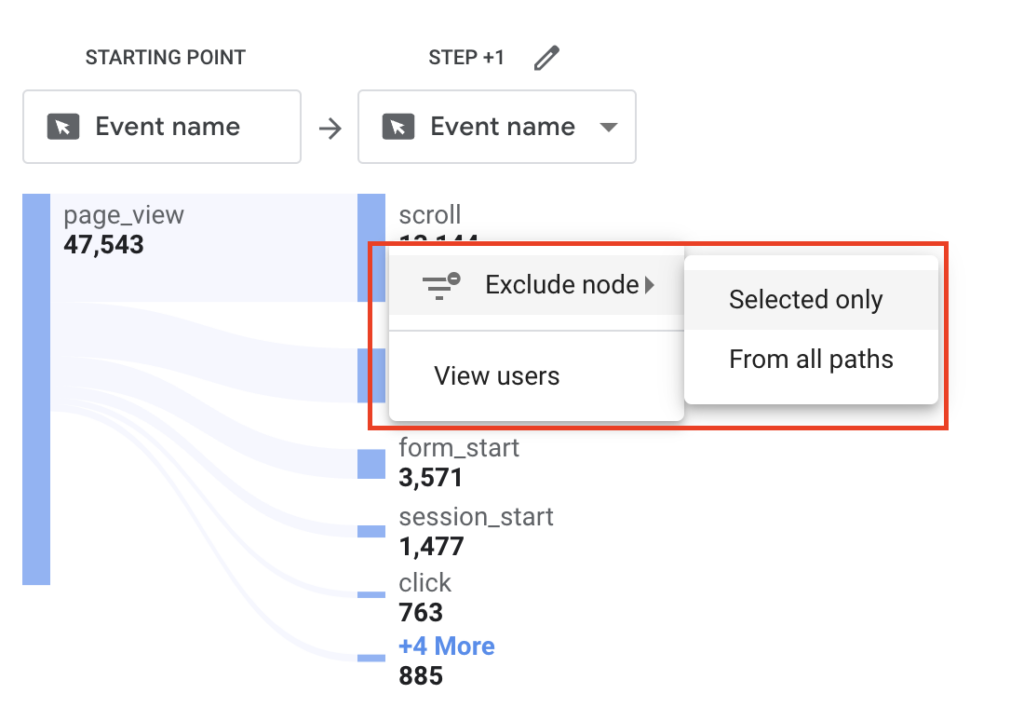
- Include or exclude data from path explorations
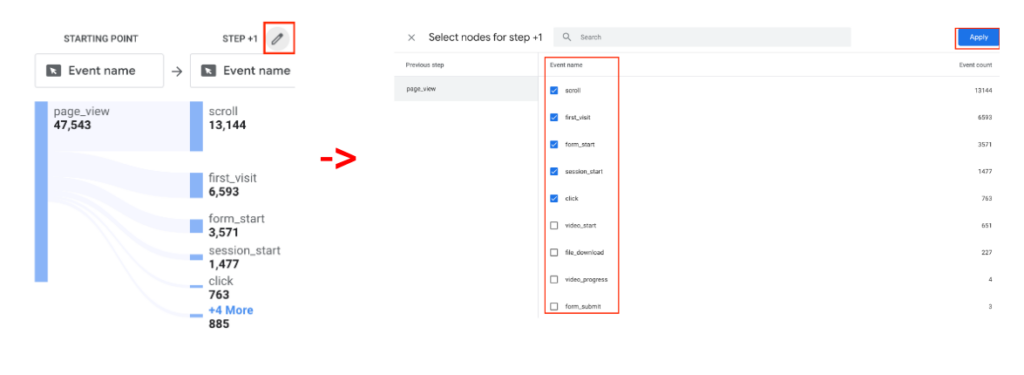
- Edit the nodes that appear on each step of the graph
2. Exclude/hide a node within the graph
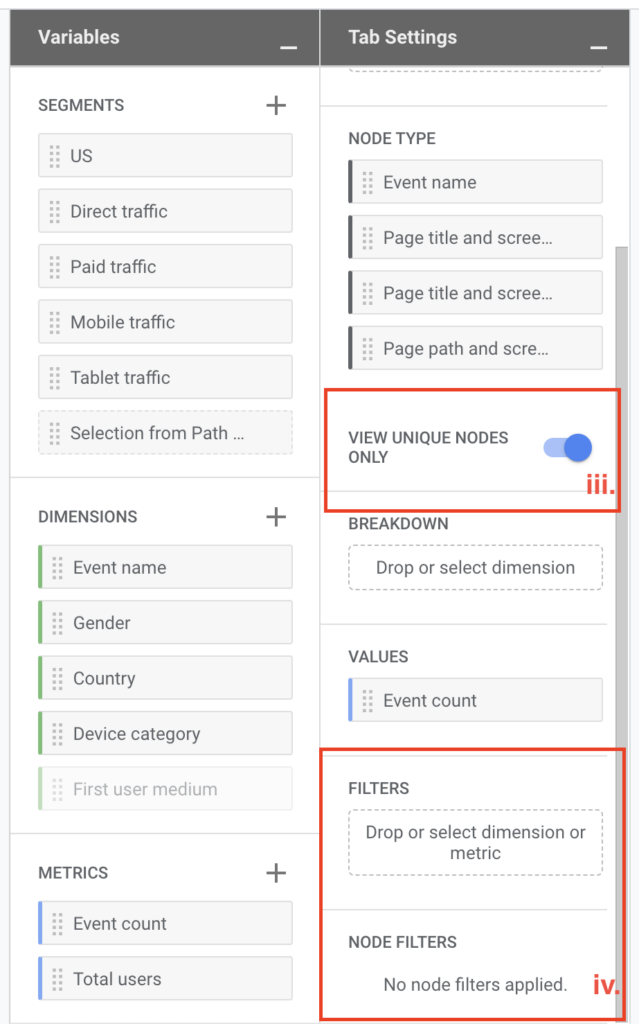
3. View unique nodes only
4. Apply segments to include or exclude users or events from the report
Now that you know how to use path explorations to better understand user pathways on your site and app, you can start building out reports. Take your understanding of users on your digital platforms to the next level and optimize your marketing, digital experience, and analysis initiatives company-wide.