

Google Analytics (GA) provides valuable insights into user behavior, but its standard interface often presents limitations when you need to perform truly advanced analysis, combine web data with other critical business information, or build highly customized reports tailored to your specific needs. For many digital marketers and data analysts, this is where Google BigQuery becomes an essential tool.
BigQuery, a powerful component of the Google Cloud Platform (GCP) suite of products, is a fully managed enterprise data warehouse service. It’s designed for interactive analysis of massive datasets, capable of querying billions of rows in seconds. While “data warehouse” might sound intimidating, BigQuery is a cloud-based, interactive tool that simplifies working with large volumes of structured and semi-structured data.
The key advantage for Google Analytics users lies in GA’s native integration with BigQuery, allowing for the export of raw, unsampled event-level data directly from your property(s). This direct access to granular data is a major step towards overcoming common reporting challenges, such as data sampling that can occur in large GA properties, and it opens the door to significantly more sophisticated analysis.
The Foundational Benefit: Unsampled, Event-Level Data
One of the most significant limitations of standard GA reporting, especially with large datasets, is data sampling. When you query data in the GA UI, Google may sample the data to return results faster, meaning you’re not always seeing a complete picture of user behavior.
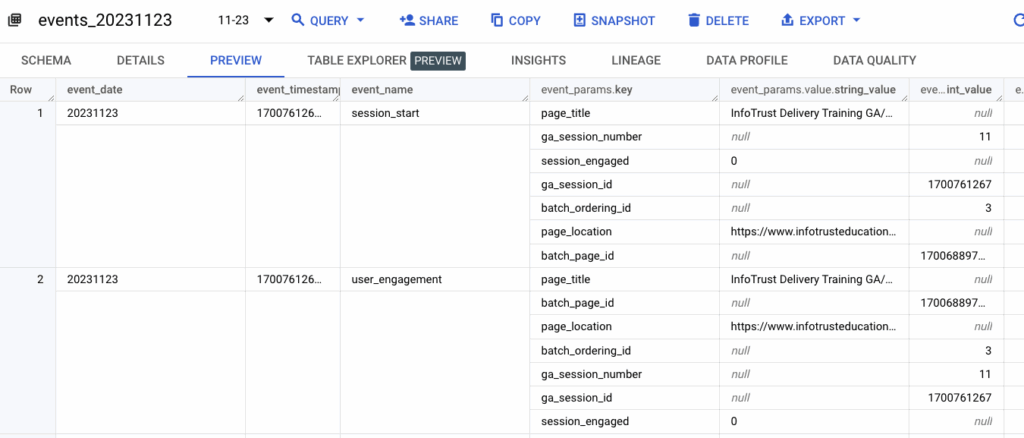
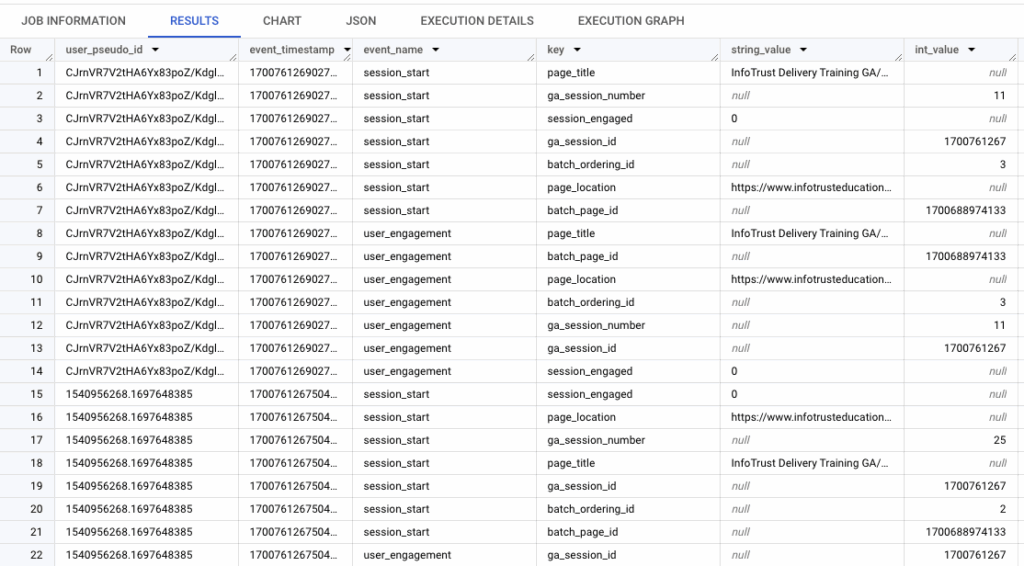
The GA to BigQuery integration eliminates this limitation by providing access to raw, unsampled, event-level data. Everything in GA is event-based, and BigQuery allows you to explore this structure at the most granular level. Each row in a BigQuery table corresponds to a single event, along with its associated parameters. These parameters can be nested, containing numerous event-specific details. This means you have access to every single interaction recorded, enabling a level of detailed analysis not possible within the standard GA interface.
Accessing this raw data is beneficial for cost savings, as it allows the complex, nested structure of events and their parameters to be stored efficiently. Understanding how to query this nested data using standard SQL techniques like UNNEST or dot notation (e.g., event_params.key) is fundamental to leveraging the export.
Key Capabilities Unlocked by BigQuery for GA Data
Integrating BigQuery with your GA data provides powerful new possibilities beyond basic traffic and conversion reporting. Several key areas where BigQuery transforms GA data analysis are:
- Advanced Analysis and Custom Modeling: With your GA data residing in BigQuery, you can go far beyond standard segmentation and reports. You can combine your GA data with other essential business data sources, such as CRM systems, Salesforce, or even advertising platforms like Google Ads, Search Ads 360, or Campaign Manager. This integrated perspective enables you to build custom data models or even a comprehensive marketing warehouse. This allows for sophisticated analysis like custom attribution models, propensity modeling, value-based bidding algorithms, or custom segmentation that precisely aligns with your unique business objectives.
- Flexible and Custom Visualization: While the GA interface offers default reports and some customization, connecting your BigQuery data to powerful visualization tools like Looker Studio, Power BI, or Tableau provides unparalleled flexibility. You can create entirely custom dashboards and reports tailored to answer specific business questions without the limitations of the standard GA reporting interface. This gives you full ownership over how you present your data.
BigQuery is highly scalable, capable of storing vast amounts of data. While managing costs is a valid consideration, the service operates on a pay-for-what-you-use model and includes free usage tiers.
| Resource | Monthly Free Usage Limits | Details |
|---|---|---|
| Storage | The first 10 GB per month is free. | BigQuery ML models and training data stored in BigQuery are included in the BigQuery storage free tier. |
| Analysis (Queries) | The first 1 TB of query data processed per month is free. | Queries that use BigQuery ML prediction, inspection, and evaluation functions are included in the BigQuery analysis free tier. BigQuery ML queries that contain CREATE MODEL statements are not. BigQuery flat-rate pricing is also available for high-volume customers that prefer a stable, monthly cost. |
| BigQuery ML CREATE MODEL Queries | The first 10 GB of data processed by queries that contain CREATE MODEL statements per month is free. | BigQuery ML CREATE MODEL queries are independent of the BigQuery analysis free tier, and only apply to BigQuery ML built-in models (models that are trained within BigQuery). |
| BI Engine | Up to 1 GB of free capacity for Looker Studio users. | This free capacity is available to all Looker Studio users, without needing a reservation. |
Managing Costs and Optimizing Performance in BigQuery
Concerns about cost and performance when working with potentially massive datasets are common, especially for users new to BigQuery.
A primary best practice for optimizing costs is to be mindful of how much data your queries will process. Before running a query, BigQuery provides an estimate of the data to be scanned. The cost of analysis is tied to the amount of data processed. A key optimization is to select only the specific columns you need for your analysis, rather than using SELECT *. While using LIMIT can restrict the number of rows returned, simply adding a LIMIT after selecting all columns is not cost-effective because BigQuery still processes data from all selected columns before applying the limit.
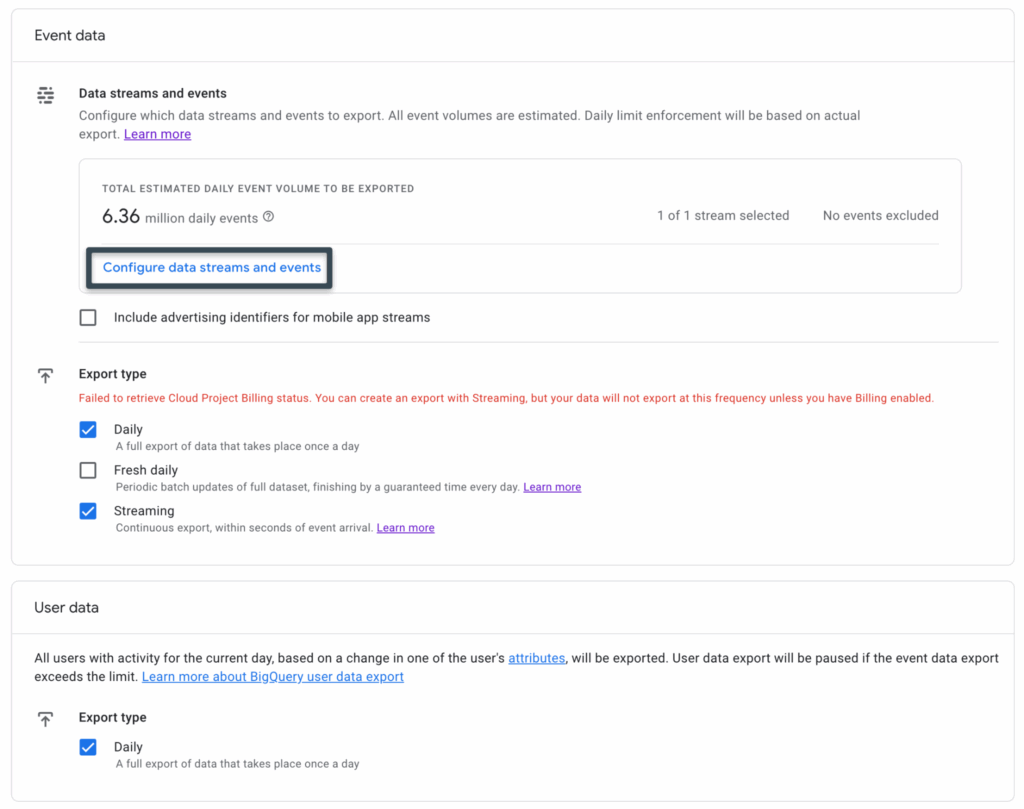
From the GA configuration side, you can also influence data volume and therefore potential costs. It is possible to exclude events that do not provide necessary data points during the export configuration. The frequency of your GA export, particularly using the continuous streaming export, can significantly increase data volume and potentially costs. BigQuery’s retention settings can also affect data volume over time. Setting up budget alerts and using monitoring tools are also recommended.
For handling large datasets without compromising performance, several strategies were recommended. These include:
- Optimize Table Design: Use partitioned and clustered tables. Partitioning divides data into smaller segments based on a column (like date), which improves scan efficiency. Clustering groups data within partitions based on columns frequently used in queries, further optimizing performance.
- Materialized Views: Can greatly benefit organizations when leveraging for frequently accessed subsets of data. These cache pre-computed query results, making retrieval faster and potentially cheaper for repetitive queries by avoiding re-processing the underlying raw data.
- Denormalize Data When Appropriate: BigQuery is often designed for denormalized, flat structures. While it handles nested data, repeatedly unnesting complex or deeply nested fields in queries can impact performance. Sometimes, flattening nested data into a separate destination table once, rather than repeatedly unnesting in multiple queries, can improve performance.
- Streamline Queries: Optimize query logic by avoiding complex transformations or unnecessary JOINs that can increase query complexity and runtime. While BigQuery can handle joins, inefficient join operations on large datasets can lead to higher costs and slower performance.
- Batch Processing: For large volume data processing, considering batch processing when running queries can be useful. BigQuery also offers scheduled queries which can be set up to run daily or monthly.
It’s important to be aware of potential limitations, such as concurrency limits in high-demand environments and query time limits for extremely complex queries.
Getting Started with BigQuery and GA: Actionable Steps
If you’re new to BigQuery but want to leverage your GA data for deeper insights, here are some actionable steps to help you get started:
- Set up the GA to BigQuery Export: This is the fundamental first step. You’ll need the necessary permissions: Owner access to the Google Cloud Project where BigQuery resides and a GA Editor role for the property you want to link. Explore the different export types available (Daily, Intraday, Fresh Daily, User). Ensure you configure the specific data streams and events you want to include in the export to manage volume.
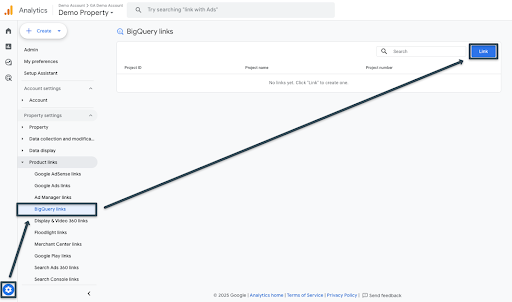
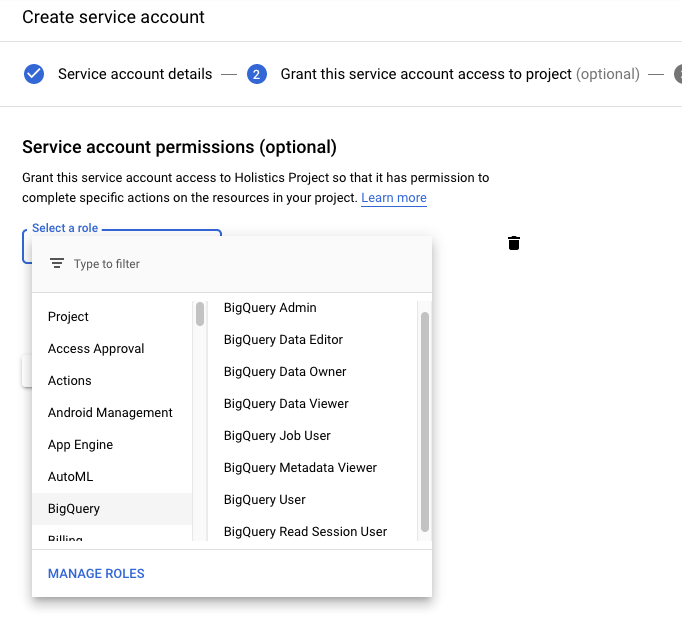
2. Set Up Proper Access Controls: When linking GA to BigQuery and managing data access, ensure the right roles are assigned through the appropriate platforms. In Google Analytics, permissions can be managed by navigating to Admin > Property Settings > Access Management. In Google Cloud, IAM roles such as BigQuery User, BigQuery Job User, and BigQuery Data Viewer can be granted via the IAM & Admin section of the GCP Console (console.cloud.google.com/iam-admin). Always follow the principle of least privilege—grant only the minimum required access to users or service accounts.
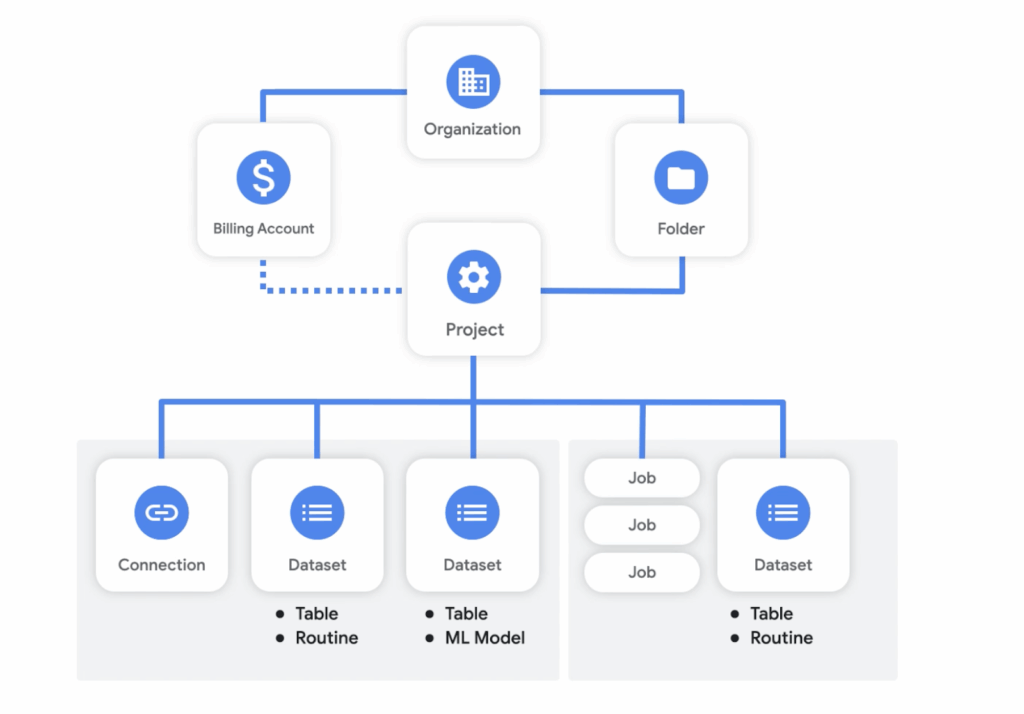
3. Understand the BigQuery Structure: Familiarize yourself with the organizational hierarchy within Google Cloud and BigQuery: Organization, Billing Account, Project, Dataset, and Table. Your GA data will typically appear in a new dataset within your chosen project, often named after your GA property ID (e.g., analytics_123456789). Tables follow a schema like events_YYYYMMDD for daily exports. Your billing is tied to a billing account, not individual projects.
4. Explore the GA Export Schema: Dive into the tables generated by the export using the BigQuery Studio UI console (console.cloud.google.com). Understand that the data is fundamentally event-based, with each row representing a single event. Recognize the nested fields within the schema. Use the preview feature in the console to see how the data is structured before writing queries.
5. Learn Basic SQL Querying: Start simple by writing basic SELECT queries to retrieve data from your tables. Gradually learn how to handle nested fields. Standard SQL requires using UNNEST for arrays, while nested fields can often be referenced using dot notation (e.g., event_params.key). The BigQuery Studio console is your environment for composing and running these queries.
6. Monitor Your Costs: As you begin querying, make it a habit to check the data processed estimate shown by BigQuery before you run a query. Leverage the free usage tiers (like the first 1 TB of query data processed per month). Apply cost optimization strategies like selecting only necessary columns and using partitioned tables. Set up budget alerts if needed. If you have not yet integrated GA and BigQuery, but wish to estimate the potential cost impact on your organization, leverage Google Cloud’s pricing estimator to make more informed decisions.
By taking these actionable steps, you can begin to unlock the true power of BigQuery to gain deeper, unsampled insights into your GA data, build custom analytical solutions, and answer complex business questions that are not easily addressed within the standard GA interface. Avoiding common pitfalls like ignoring data scanning costs, overuse of complex nested fields, and lack of monitoring is also key to successful BigQuery usage.