

Have you ever noticed that the Google Analytics data model includes two metrics for reporting on revenue collection: revenue and product revenue? And not only is it confusing that there are two different metrics essentially reporting the same thing—they’re often not in alignment.
What gives? Allow me to explain the nuanced differences between these two metrics and why it is actually important that the data model includes both.
Scoping Differences
The first thing to know is that both of these metrics are intended to report on revenue at different scopes of reporting. In an eCommerce context, there are typically two different levels of reporting—order-level and product-level. The order-level represents a single purchase event, and the product-level represents all the items included in the purchase (of which there can be several). Another way to think about it is that order-level revenue is the total amount collected from the entire shopping “cart,” whereas the product-level revenue is the amount collected from each individual item in the shopping cart. Because of this one-to-many relationship between a single order and the multiple products in that order, the Google Analytics data model leverages two different metrics to report on revenue at each of the levels.
- Revenue: The aggregated metric for the entire purchase. This used for reporting revenue at the session and user levels and is the metric most commonly used reporting across the various Google Analytics reports.
- Product Revenue: The metric representing individual product contributions to total revenue. This is used for reporting exclusively at the product level and is generally only included in the product-based eCommerce reports in Google Analytics.

Implementation Differences
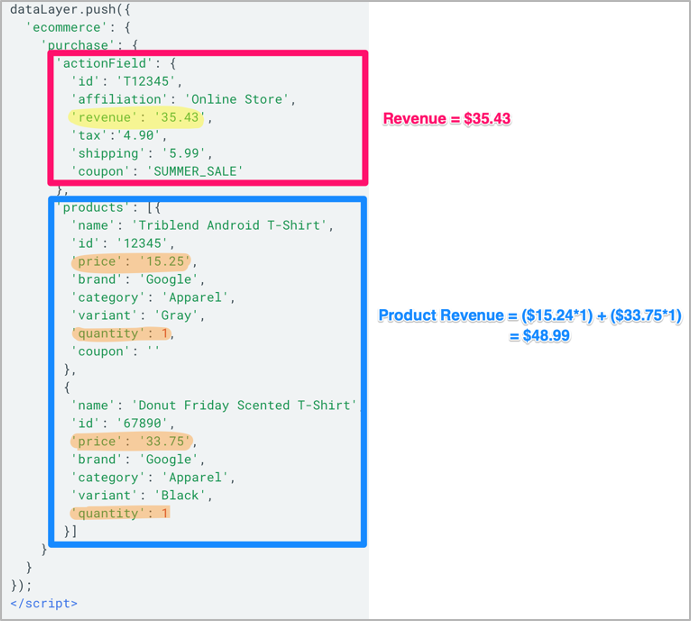
Not only is there a difference in scoping, there is also a difference in how the data is collected and processed in Google Analytics. The order-level “Revenue” metric is the summation of the cart total that passed in the purchase event as a single value (i.e. sum[cart total]). The product-level “Product Revenue” metric, on the other hand, is the sumproduct of the unit price and quantity for each product in the order (i.e. sum[price X quantity]). Because there are more inputs used in the calculation, this requires additional backend processing in Google Analytics to derive the metric from what gets passed in the purchase event
Below is an example of a purchase event showing how each metric would be reported in Google Analytics based on the values passing in implementation:
Common Causes of Reporting Differences
Because of these aforementioned scoping and implementation differences, it is not uncommon for there to be (sometimes significant) differences in the values reported for revenue at the different levels. Here are the most common reasons that help explain those differences:
- Order-level “Revenue” includes additional values for tax and shipping amounts that are not easily applicable to each item at the product-level “Product Revenue.” This will result in the order-level “Revenue” reporting higher than “Product Revenue,” which would not be accounting for those additional amounts added to the order.
- Coupons are applied to the order-level without discounting the individual product prices. This will result in the discounted order-level “Revenue” reporting lower than “Product Revenue,” which would still be calculated based on the full-price items.
Questions about Your Revenue Reporting?
Now that you understand the scoping and implementation differences between these two similar metrics, it is important to remember that they both exist in the data model to serve different purposes. “Revenue” serves as your baseline revenue metric that you will use to understand your overall revenue collection from your site in the majority of your reporting. “Product Revenue,” however, is more specifically used to understand how much revenue each of the individual products on your site is contributing and can be particularly useful in a merchandising context to know what your top-selling and/or underperforming products are.
Hopefully you now have a good grasp of what differentiates these two revenue metrics in the Google Analytics data model. Certainly contact our team today if you have any questions specific to your eCommerce revenue reporting.