
With the widespread adoption of stay-at-home policies across the globe, many of us are juggling our professional and personal responsibilities while working from home. To help make the most of your time, we’ve compiled a list of analytics tips and tools that will allow you to get more done and free up some time.
1. Automated Reporting (2+ hours per week saved)
One task to cross off your to-do list for good is manual report creation. There are several ways you can automate analytics reporting.
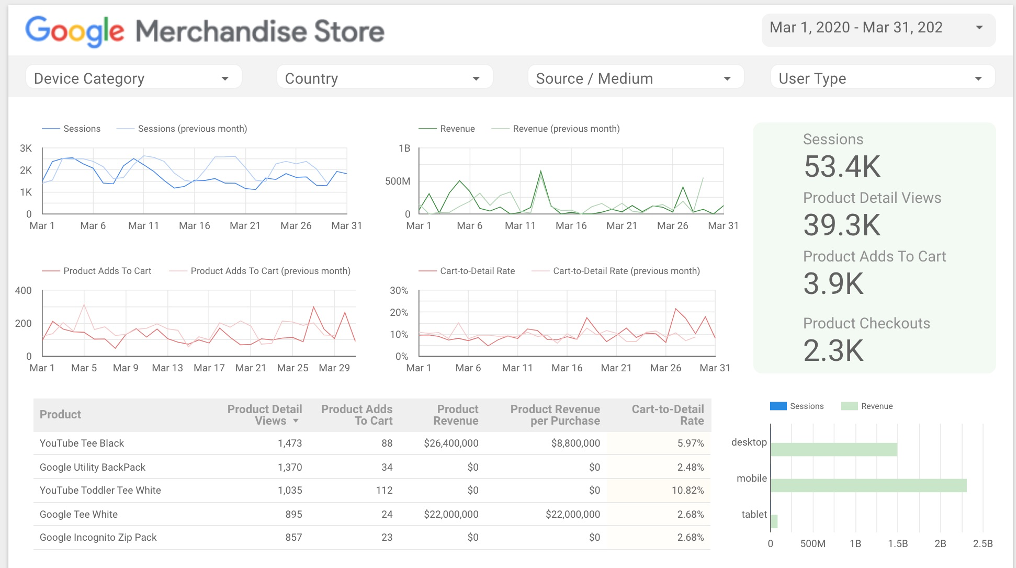
Data Studio
Data Studio is Google’s data visualization platform. It’s free to use and easy to get started with. When you connect your Google Analytics (GA) data to Data Studio, you can build interactive dashboards. Users can adjust the date range and add their own filters to analyze the data. Once you set up the report and share it with your colleagues, you’re done!
Emailed Reports
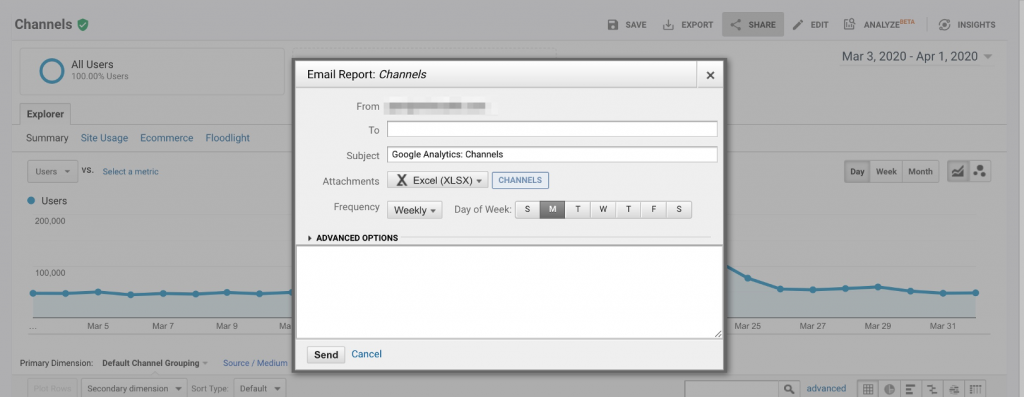
If part of your job is sharing analytics reports with your colleagues, then the Email report feature in Google Analytics will definitely save you some time. From the GA user interface, click the Share button in the header. You can set the recipients for the report, the file format (.pdf, .xlsx, .csv), and the frequency (once, daily, weekly, monthly quarterly). Click send and say goodbye to manually emailing reports.
Saved Reports
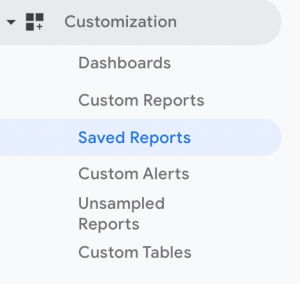
If you frequently visit the same reports in Google Analytics and apply the same segments, secondary dimensions, filters, and sorting, then the Saved Reports feature will help you pull these reports more quickly. Configure your report as usual and then click the Save button in the header in Google Analytics. This will save the report’s configuration and store it in the Saved Reports section of the left-pane navigation menu for easy access, saving time and manual work!

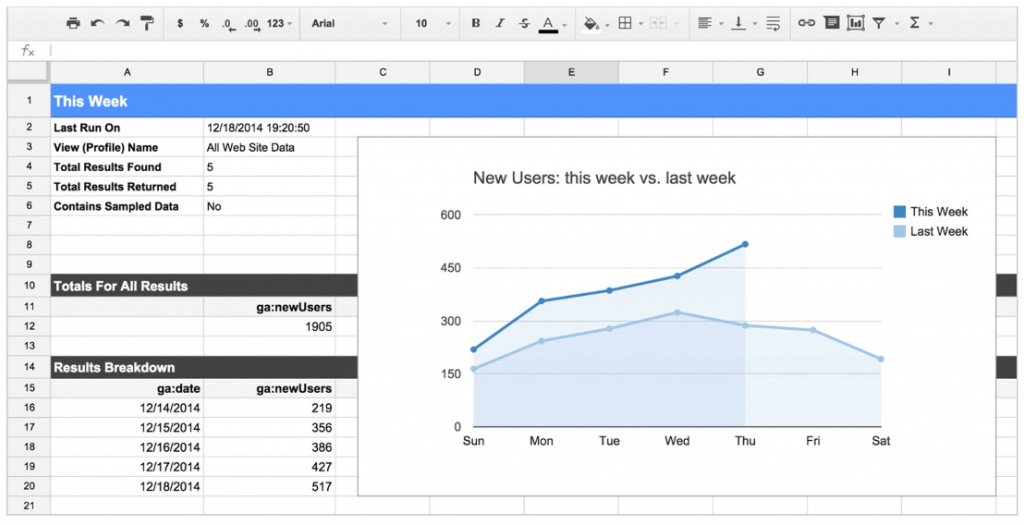
Google Analytics Add-On for Google Sheets
If your organization prefers spreadsheet-based reporting instead of dashboards, then the Google Analytics add-on for Google Sheets is a great solution for automating reporting. By connecting Google Analytics to Google Sheets, you can pull your analytics data directly into a spreadsheet. This makes it easy to perform whichever calculations or aggregations that you need. You can also set the reports to run automatically to eliminate manual reporting going forward.
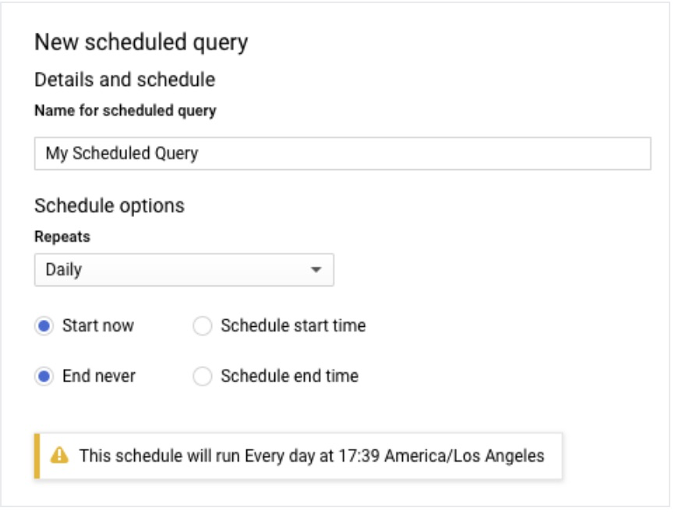
Scheduled Queries
If your organization stores its analytics data in Google BigQuery (via the native integration) and uses that data for reporting, then you can take advantage of the Scheduled Queries feature in BigQuery. Here’s how this is typically done:
- A query is written to calculate analytics metrics for a report or dashboard;
- The query results are saved to a table in BigQuery;
- Your IT department schedules the query to run on a server to provide up-to-date reporting.
With scheduled queries, you no longer need to work with IT to run the query on a server. You can configure how often you want the query to run and where it should save the results directly from the BigQuery UI. This feature saves time for both you and your IT department.
2. Monitoring and alerting (2+ hours per week saved)
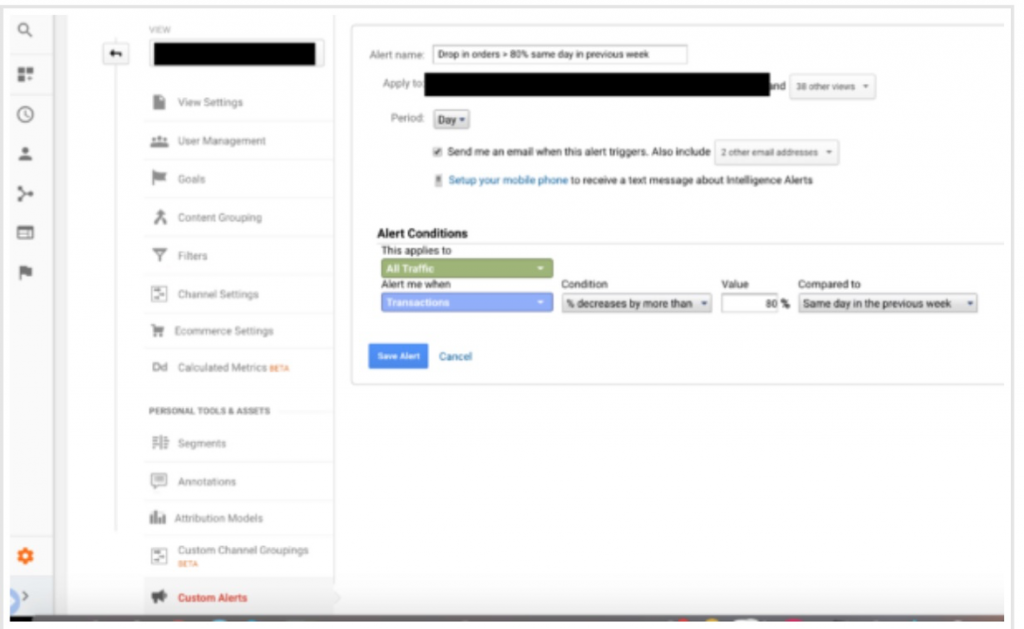
Custom Email Alerts
You can configure custom email alerts so that your team can be notified of drastic changes in GA metrics. From the GA UI, create a new alert by selecting the metric, frequency, and alert conditions. For example, you could set an alert to trigger an email or text when revenue changes by more than 50% week over week. With these alerts in place, you’ll know sooner if something has gone wrong and can leap into action to fix it.
Check out this post by my colleague, Amin Shawki, for a walk through of how to set up custom alerts in your GA account.
Anomaly Detection
Anomaly detection is one of several machine-learning-driven capabilities that Google added to GA as part of Analytics Intelligence. For anomaly detection, GA regularly scans your analytics data to determine if any “outliers” or anomalies occurred in your data. It uses advanced statistical models to forecast the value of recently-observed data points and compares those forecasts to the data actually collected by GA. If there is a significant difference between the forecasted and observed values, GA flags this as an anomaly. This saves time because Google does the work of identifying the anomalies so that you can focus on what they mean and why they occurred.

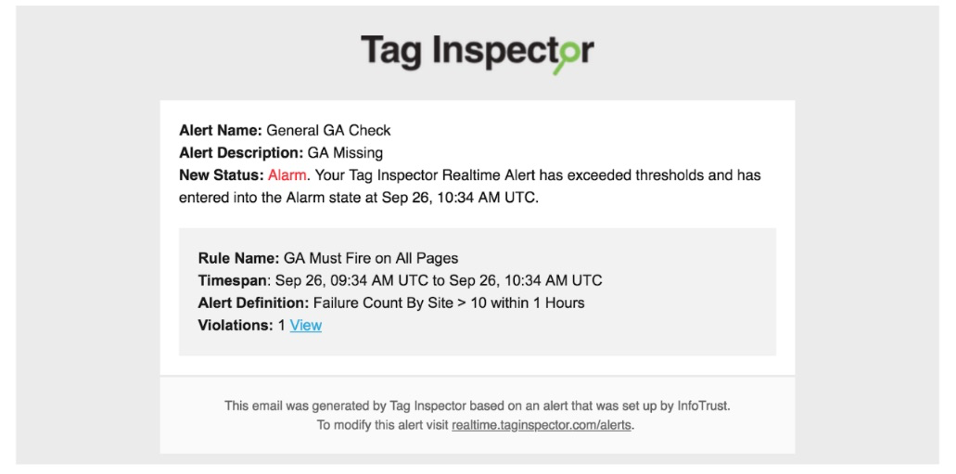
Alerting Using Tag Inspector
To monitor your data collection across multiple platforms, not just GA, the engineering team at InfoTrust built Tag Inspector. Tag Inspector is designed for marketers by marketers and puts data quality first. It can monitor the live behavior of tags, short snippets of code that are used to collect information about the visitors to a website and their behavior. By monitoring the tags on your site and setting up validation and alerts, you can ensure that you’re sending high-quality data to all of your marketing platforms. You may have heard the expression “garbage in, garbage out” applied to analytics, meaning that if you have flawed data flowing into your reports, you’ll undoubtedly have flawed insights coming out. When you set up monitoring and alerting with Tag Inspector, you protect your organization from propagating “garbage” data across all of your marketing platforms.
Check out this article by my colleague, Lucas Long, about how to set up alerting for your website.
3. Analysis (4+ hours per week saved)
Insights
The Insights cards within GA’s Analytics Intelligence make it easier for you to uncover meaningful insights from your data. GA performs analysis on your data to identify trends and opportunities and provides Insights cards in the UI that you can save and share. It might find, for example, that page load times are slower than average for specific browsers or may suggest increasing investment in a particular campaign that is performing well. You can also ask Analytics Intelligence questions and receive real-time answers, such as What’s the month-over-month growth rate of my users? Insights are a great place to start for performing analysis and are especially helpful if you’re new to Google Analytics.

Change Exploration
One more feature of Analytics Intelligence that can help you save analysis time is Change Explorations. I expect that many of us have asked or been asked why a particular metric changed over time, such as “Why was revenue down last week?!” With Change Explorations, GA identifies segments of data that are likely to explain these changes. To use Change Explorations, type a “Why” question into the search bar that specifies the metric of interest and the time period. GA will analyze the data, present the top 3-5 explanations, and show how much each segment changed. In our experience, Change Explorations are valuable because they do the heavy lifting of analyzing across multiple dimensions and segments. With those insights in hand, you can skip right to deep-diving into the specific circumstances driving the changes in your data.

Solutions Gallery
Finally, there are many pre-made reports and dashboards that you can copy to your own GA account via the Solutions Gallery. You can find reports focused on analyzing content performance, SEO, acquisition, and more. Simply import the reports into your account to jumpstart your analysis.
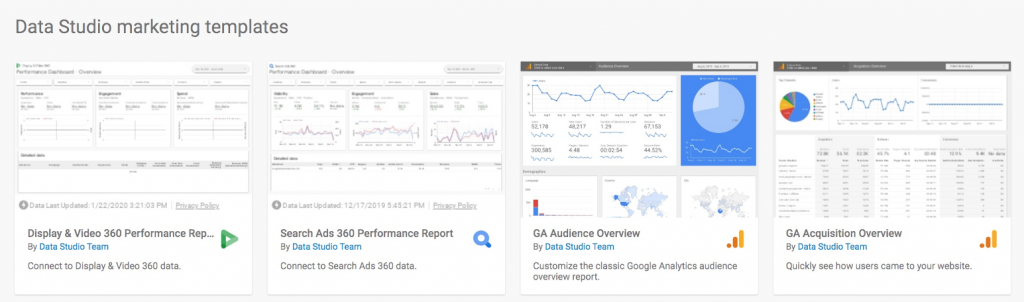
Similarly, Data Studio has a Report Gallery with template dashboards to help you analyze your eCommerce activity, search ads performance, Display & Video 360 performance, and more. Once you copy the template and connect your data sources, you can dive right into analysis.
4. Cost Data Integration (2+ hours per week saved)
A common challenge for marketing teams is understanding campaign performance across different marketing platforms—Google, Facebook, Bing, etc. To help provide a more holistic view of your marketing mix, you can leverage the Cost Data import feature in Google Analytics. The cost data import allows you to import click and cost data for non-Google campaigns so that you can compare performance across all platforms. By combining this data with your analytics, GA will calculate the return on advertising spend (ROAS) for each campaign. This saves time because you now have one report that summarizes campaign performance and you no longer need to manually analyze the data from multiple platforms. For even more time-savings, you can automate the upload of your cost data into GA.

Bonus!
As you review your workload and identify ways to save time, don’t forget to focus on your high-leverage activities, or the “tasks that you perform [that] contain most of the value that you contribute to your business.” What truly are your team’s KPIs? Which of your initiatives has the greatest impact on the bottom line? Honing in on the ways that you drive the greatest value for the organization helps you clear the clutter from your to-do list and make more time for what truly matters.
Do you have other time-saving analytics tips? Contact our team and let us know.