
For years, Google Analytics has been known for its simple hierarchy of Account > Property > View. If you took a Google Analytics Academy course for Universal Analytics (previous version of Google Analytics, which will sunset for standard properties on July 1, 2023), you may remember that they recommended creating three views:
- Raw Data View, which you keep as a data backup and don’t apply any filters or data manipulations to
- Master, or Main Reporting View, to serve as your main data source for production reporting
- Test View, which allows you to test product integrations, filters, channel groupings, and other settings before you roll them out to the Main Reporting View
You could use a test view for the initial configuration of your reporting data and safely apply filters since you knew nothing would have happened to the underlying data if you accidentally overwrote an account-level data filter while editing it in a newly copied view. (You can probably sense I’m speaking from experience.)
Now that Google Analytics 4 (GA4) utilizes an event-based data model, the way underlying data is collected, processed, and sent to the GA4 user interface is different. Data collected by different data streams (web and app) will flow into the properties as a stream of events and event parameters, automatically collected and customized. Global privacy regulations and the need for the analytics platform to aggregate user information in order to protect each individual user’s identity have also impacted the set of features that made it into GA4.
In this article I will break down the most common use cases for views and provide an alternative you can use in GA4 in the absence of views.
Views to filter out “internal” traffic (for example, traffic from company-owned devices or developer traffic)
Only two data filters are available for GA4 properties at the time of writing this article. They are “Developer Traffic” and “Internal Traffic”. You can create them by navigating to Data Settings > Data Filters at the property level.

Internal traffic is now identified by the parameter traffic_type and you can define a custom parameter value for this event parameter if you don’t like the default of “internal”. You can create rules that specify which ranges of IP addresses will identify internal traffic. Currently, IP ranges need to be written in CIDR notation. Please note that you can only configure IP addresses to be evaluated for internal traffic rules at the data stream level. We have written a blog post that covers these data filtering options in greater detail. We hope that more options will be available in the future as the product evolves.
Keep in mind that filters for IP in GA4 are limited to 10 records only. Therefore, the ideal approach is using CIDR notation to fit them all in. If you are going to create CIDR notations for the first time, bookmark these two sites that you will need to validate whether the notation is accepted: ipaddressguide.com/cidr converts CIDR to IP range and IP range to CIDR. We like to use https://www.regextester.com/ as a tester/debugger for the final notations.
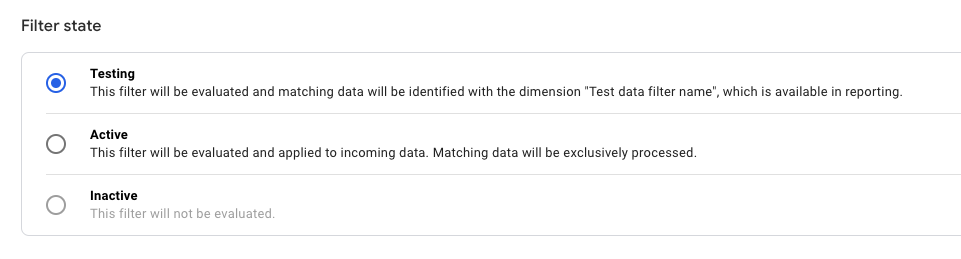
Wondering about the ability to test the filter in a test view before applying it to a main reporting view? Before, you could use a raw data view and a filtered view to keep a record of unaltered and altered traffic. Now, you have the option to select a different filter state. An “active” filter state allows it to be evaluated and applied to incoming data where only matching data is exclusively processed. A “testing” state will simply label the matching data with the dimension “Test filter data name” which you can use in reporting to include or exclude developer traffic data. We recommend that you keep the internal filters in the “testing” state.
Views filtered based on a subset of data (for example, traffic from a specific country or a subdivision)
Many filter types that existed in Universal Analytics and were available for a selection are now built into GA4 as a reporting feature.
We already talked about filtering internal and developer traffic based on an IP address. If you have had views that were filtering traffic based on a hostname, this has migrated into Explorations where you can create a report using Hostname dimension or create a segment comparison that uses Hostname dimension to compare traffic to one of your domains to the rest of the traffic in the property. These are the two ways of filtering data in Explorations.
There is one limitation to Explorations reports: you can only share an Exploration report with other users in read-only mode, so there is no way for other users to filter a report further. For example, if you have a report on key landing pages but wanted to let an end-user filter for the pages they were interested in, let’s say only the articles written on a specific topic, or only the products in the shoes category, they would have to duplicate the report and add a filter to their own version of it.
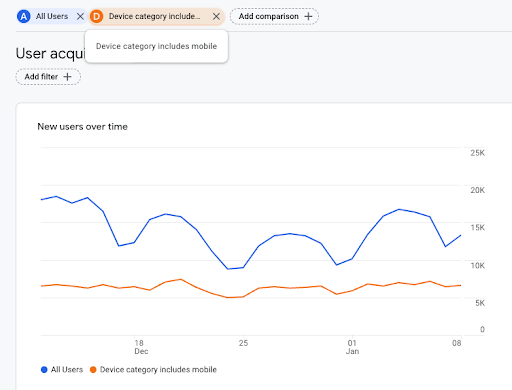
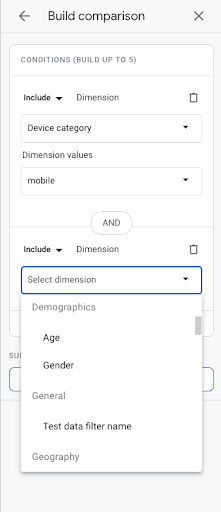
What if you need to filter your standard reports? We recommend that you use comparisons for this purpose. Comparisons will allow you to filter within the GA4 user interface by selecting standard or custom dimensions. You can still type in a dimension name like you are used to in Universal Analytics. Comparisons remind me of how segment comparisons worked in Universal Analytics minus the word segment.
Views that filter out bot and spider traffic
Filtering bot traffic is something you have probably become accustomed to if you’ve worked in Google Analytics for some time. You may have created sophisticated filters to remove bot activity from your data, or went a step further and had rules evaluating whether to fire or not fire a GA tag based on the presence of a specific variable value in the data layer. The good news is, GA4 now excludes all known bots and spiders by default.
Can you still create a raw unfiltered view? No; however, you can create an additional GA4 property to use for data comparison. For example, you can create a property with Google Signals enabled with blended identity and create another with Google Signals disabled and a device-only identity (which is, by the way, most similar to the measurement you are used to in Universal Analytics). You do not need to create another property just to filter out suspected bot traffic.
Views given to individual analytics users that would have had data only appropriate to their business function (no revenue data)
As a part of their user management features overhaul, GA4 introduced five standard user roles: Administrator, Editor, Marketer, Analyst, and Viewer. Additionally, it introduced additional user roles (also known as data restrictions): No Cost Metrics (no cost-related metrics can be seen by this user) and No Revenue Metrics (this user won’t be able to see revenue-related metrics).
In Universal Analytics, the ability to control this data was given to a view. Now, in a more user-centric environment, you can control who gets access to what data by associating access to the user, not by placing a user in a bucket with a view of a specific slice of data. This feature is a great enhancement to how admins used to be auditing and managing users by verifying their access to each view. Now the audit of user access needs only to be done once.
You can grant additional user roles at the time you grant or edit an individual user access to Google Analytics.
Views that combine several account-level and view-level filters (for example, to create a custom view for a subdivision from a specific region or a custom view only for the shopping area of your informational website)
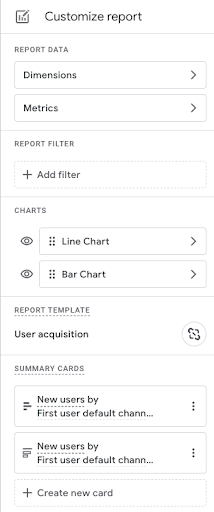
There are no account-level or view-level data filters in GA4. At the moment, filtering exists at the data stream level of the source property (for internal and developer traffic) or at the subproperty level only. Users are encouraged to use Explorations to create custom reports or export data to BigQuery, where they have greater flexibility and control over how many dimensions and metrics they can bring into their data. Additionally, you can customize your standard reports using Customize report options in the right-hand menu.
There are additional data filtering options available for subproperties. Selected data filters will include or exclude data from the source property, based on criteria that you specify. The subproperty will only provide access to this subset of data. However, a full range of standard and custom dimensions are available for selection. We recommend that you only use subproperties as an alternative property configuration such as when you need a property in a different time zone, currency, or with different product integrations and/or Signals and identity configuration settings. If you simply decide to use subproperties as a substitute for filtered views in GA4 it may lead to inconsistencies in data across multiple events.
DFP (DoubleClick for Publishers, now Google Ad Manager) View
Finally, the last common use for views, at least among the clients in our News/Media vertical, is the DFP (or Google Ad Manager) view. The reasons for having DFP views are now gone. Originally, it was done to prevent external sharing of data by third parties or individual analytics users. The current Ad Manager reporting integration allows publishers to see integrated reporting between Ad Manager, Google Analytics, and data restrictions at a user level introduced in GA4 to prevent users from seeing revenue metrics. Furthermore, the ability to create a “testing” state internal traffic filter allows you to filter out developer and other internal traffic which you don’t need when you analyze Ad Manager metrics.
Conclusion
Overall, when it comes to replacing Universal Analytics views, the approach that we are adopting at InfoTrust is to make our users empowered to use standard reports, customizations, and comparisons along with Explorations. We encourage users who rarely go to the Google Analytics reporting interface itself to continue relying on a native integration of GA4 with BigQuery (now available for both standard and 360 properties) to create your own custom data sets with endless possibilities for data transformations and creation of different views. You can then connect those views to Looker Studio for data visualization and report distribution.