Intro
One of the key steps in an organization’s journey to greater digital analytics maturity is connecting its Google Analytics (GA) to BigQuery (BQ). The integration between GA and BQ gives marketers ownership of their complete, hit-level analytics dataset, which opens the door to many additional opportunities for analysis and optimization. Here’s our list of the top four things you can start doing now to move your organization forward by utilizing the integration between GA and BQ.
Note: This post covers the integrations with BQ for both Google Analytics 360 (GA360) and GA4, the next generation of GA. When we refer to GA, the information is relevant for both platforms; when there are differences between the platforms, we’ll call them out explicitly.
For more information on using BigQuery, check out our other posts: what is BigQuery?, the integration between GA and BQ, how to get started with BQ, and data concepts and how they apply to BQ.
Analyze
Gaining access to your complete, hit-level dataset from analytics provides ample new opportunities for analysis. In addition to being able to build custom reports, the GA data in BQ includes some fields that are not available in the GA UI.
For GA360, these include visitNumber, hitNumber, and isTrueDirect:
- visitNumber allows you to analyze users’ sessions sequentially and create session IDs.
- hitNumber enables pathing analysis by allowing you to sequence hits.
- isTrueDirect allows you to see traffic source information prior to the application of the Last Non-Direct Click attribution.
Similarly, for GA4, these fields include:
- The event parameter ga_session_number – like visitNumber
- event_timestamp – enables pathing analysis like hitNumber
Having your data in BQ makes it possible to analyze cohorts, fit your own attribution models, understand the user journey, and perform basket analysis.
Finally, access to hit-level data is conducive to integrating GA with other datasets. Common use cases include:
- Joining additional user-level attributes from a CRM or CDP, such as lifetime value or loyalty program status
- Widening product-level attributes for enhanced analysis of e-commerce performance, such as size, color, or product line
- Widening content-level attributes for publishers, including author, publish date, and tags
- Enhancing campaign-level analysis by bringing in additional fields related to targeting and creatives
Regardless of whether you’re diving into the GA data on its own or connecting it with other data sources, putting your SQL skills to work in BQ can help you uncover many new insights and opportunities for improvement.
Predict
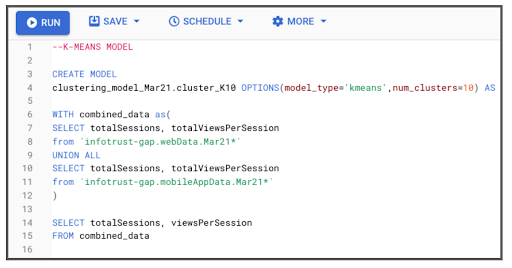
With your analytics data in BQ, you can leverage Google Cloud Platform’s (GCP) built-in machine learning and AI-powered tools to get started with predictive modeling. The most straightforward way to start is by using BigQuery ML (BQML), which allows analysts to fit sophisticated models in BQ using standard SQL queries. BQML currently supports several model types, including:
- Classification – used for predicting a binary outcome (yes/no), such as propensity modeling
- Regression – used for predicting a numeric value, such as spend
- Clustering – used for segmenting similar users
- Time series – used for forecasting
- Matrix factorization – used for recommendation engines
BQML

Experienced data science teams can build models using Vertex AI, a unified UI for the entire ML workflow, including pre-fit models, end-to-end integration, and MLOps. For the fastest setup, analysts can customize and deploy pre-trained models for regression, image and video classification, and natural language processing. Data scientists can also develop custom training pipelines, use Explainable AI to help understand model outputs, and track model quality using Model Monitoring.
These models can be used to grow your understanding of the complex relationships in your data and for activation.
Activate
Activating your data can take many forms. A very common use case is to use the predictions from a propensity, customer lifetime value, time-to-reorder, or segmentation model for audience targeting. Propensity models are well-suited to improving retargeting campaigns whereas customer lifetime value models can be used to nurture loyal customers, prevent churn, and execute a customer-centric marketing strategy. Time-to-reorder models can help you reach customers when they’re ready for their next purchase and segmentations can be used for personalization, acquisition, and in general, to better understand customers’ needs.
Audience targeting with GA

Other paths to activation include:
- Forecasting revenue to help meet sales goals
- Improving customer retention by analyzing cohorts
- Optimizing marketing campaigns by fitting custom or complex attribution models
- A/B testing website/app changes based on user journey analysis
- Optimizing product bundles and offerings via basket analysis
- Increasing average order value (AOV) or engagement by implementing a recommendation engine
Share
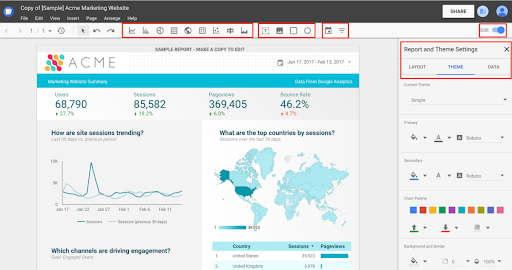
While focused on deriving insights from the data, sometimes teams overlook how the results from these analyses will be shared within the organization. Self-service dashboards, such as those built with Google Data Studio or Tableau, are commonly used to share findings and drive action across teams. When planning for a new dashboard, it’s important to be clear on who needs access to the dashboard, what actions you expect teams to take, what data is needed and where it should come from, and which data visualization platform has the right features to meet these needs. We’ve noticed a pronounced increase in standardized reporting and dashboarding, especially for organizations that have migrated their data to BQ/Google Cloud, that empowers teams to make decisions quickly and strategically.
The best dashboards have a clear, focused design, avoid common mistakes, and automatically update. Data Studio and Looker are popular choices as they have native integrations with BQ that help reduce set up time. Power BI, Tableau, and Domo are also commonly used.
Data Studio


