
Cohort analysis is the bedrock of understanding your customers. Simply defining a segment of customers and analyzing their behavior over time is a big step in knowing what is happening in your business. Better yet, it’s simple and it works.
Cohort Analysis In Action
I once worked with a company that wanted to better understand why top-line sales were declining for two years in a row. Surface-level analysis indicated that a variety of product categories had been declining, which meant we had a product-mix problem to solve. (Obviously product category sales were declining, because top-line sales were, as well.) More analysis indicated discounts were being used by customers less often, so perhaps the promotions were simply less enticing? Even worse, new customer acquisition was on the decline.
Panic ensued within the company and things were looking grim, but none of these symptoms told a complete customer story—this is because none of these individual analyses added up to a complete view into the customers who were responsible for the decline. The organization’s CMO had assembled a team to tackle each one of the problems individually, but what good is sending more emails if you don’t know who you are emailing and what they want? Through some sophisticated clustering, we segmented customers by characteristics like:
- Customer lifetime value
- Purchase frequency
- Total purchases
The results of our cohort analysis were what some might suspect: the business had a large pool of low-value customers that made up roughly 40% of top-line revenue. They would come and go, probably purchasing once a year; however, as a segment, revenue was steady. On the extreme end, we saw a pool of roughly 500 customers (<1%) which accounted for 18% of revenue, who had steadily stopped purchasing, one-by-one, year after year. The top 1% of customers—the company’s best customers—accounted for much of the decline in year-over-year top-line revenue.
Next, we studied this cohort in a 5-year retrospective to better understand what had happened. Those results informed a multi-touch campaign to win them back (or find new customers that matched their profile). The CEO even volunteered to call a few! We had a solid plan to win back the organization’s customers, informed by our cohort analysis, and it worked. Not overnight, but over several quarters. The lesson was simple: Don’t analyze your business by financial performance alone. Take a look at the health of your customer file.
Your Next Step
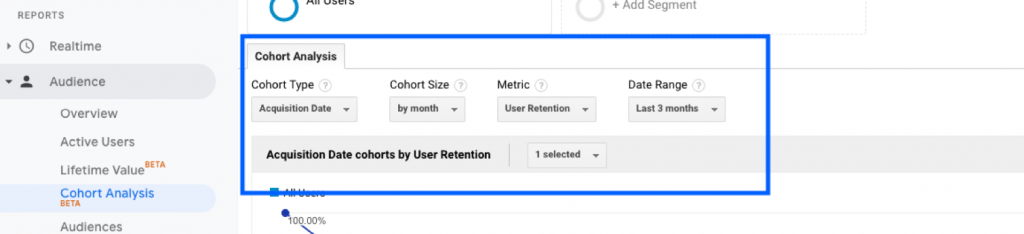
I share this story because Google has developed an out-of-the box solution in Google Analytics, which will be a great start for many analysts to try their hand at cohort analysis. The menu pictured below allows you to define your cohort and then measure customers over time. It’s limited up to a month’s worth of acquisition and only a handful of metrics, with a 90-day reporting window, but it’s easy to use.
In the example below, I can see the average revenue per user based on the month they were acquired and then three months over time.
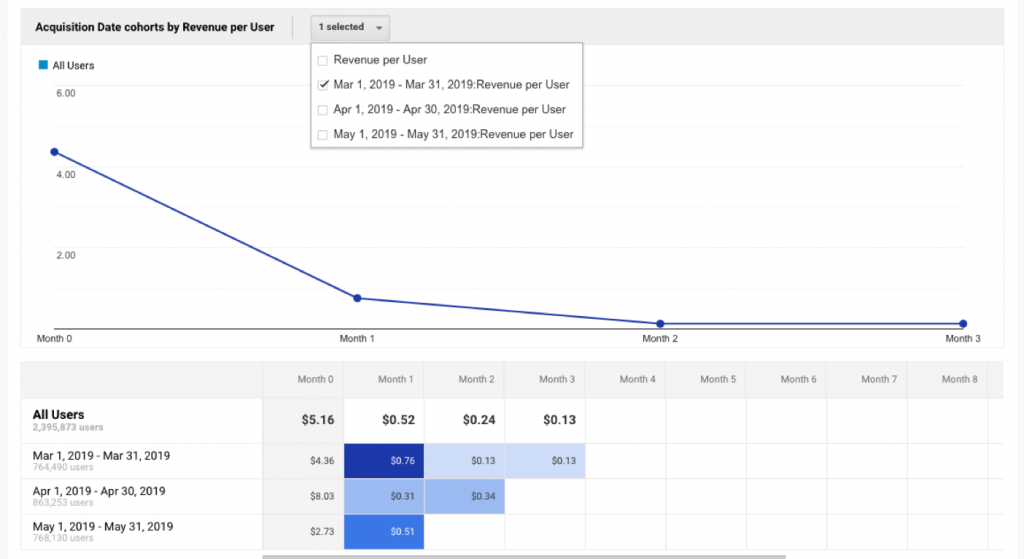
This analysis gets even more fun when you start to layer segments on top of the report. Below I am comparing paid search and email channels. There’s a fair amount of variability, but it’s starting to help us get a clearer picture of what’s happening. We can see a steady drop off after the first month of acquisition, but then what happens in the following quarter? What if your customer sales cycle doesn’t fit the available reporting? Then it’s time to create a new report!

Digging Deeper
I will start by saying thank you to Google for making the cohort analysis report available in Google Analytics—it’s appreciated. However, it has always left me wanting more; the time range is limiting, as are the available metrics. It’s possible to dig deeper in Google Analytics, and one approach is to build a segment that uses “Session Date” and apply it to reports. You will still run into the limitation of 31 days for the cohort, and you still have a 90-day reporting window, but this will take you much further than the out-of-the-box report that I find so limiting. You can also run reports for subsequent 90-day increments to achieve a more complete view of the customers, whereas the original report has no date selector at all.
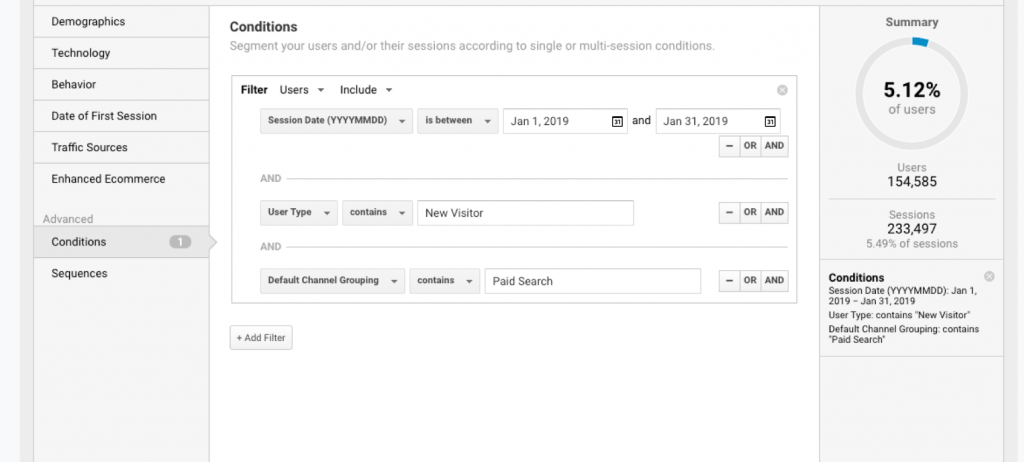
Below is a segment that I’ve created for my analysis, I’m analyzing new customers that were acquired in January from paid search.
Below is a custom report I’ve built to analyze these customers. I would like to know how many customers are returning each month, by which channel, and how much they spend when returning.
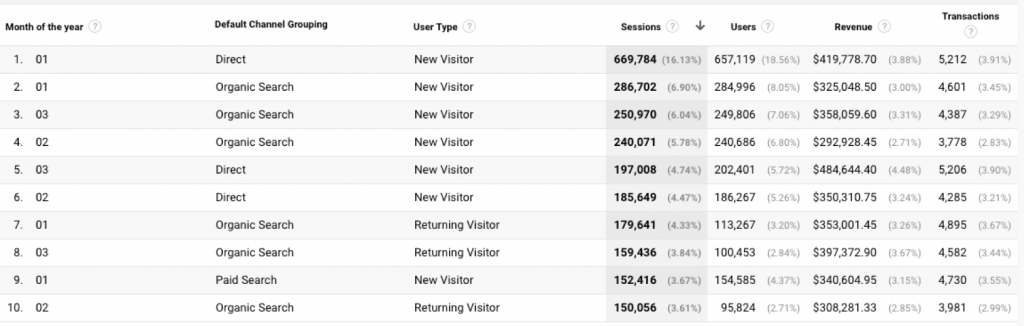
Spending a little bit of time in Microsoft Excel shows that most of these customers never returned after January, but the largest majority returned via Paid Search. Focusing on their revenue per session for the first three months indicates only slight variances in how much they are spending. I would look into creating a remarketing campaign after two months to continue to engage these customers.

If you capture a customer’s ClientID or a unique identifier, this will allow you to do even more analysis at the user level. For instance, you could analyze the patterns of each customer to understand which channels they return on and how much they spent; this is a fantastic hybrid of cohort analysis and the multi-channel funnel reporting.

While I have taken a campaign approach to my analysis, we could also focus on products and do a market basket analysis for customers who purchased a specific product and then their subsequent purchases. Leveraging an advanced segment in Google Analytics gives you far more flexibility than the out-of-the-box report, but there’s still more to come. BigQuery, Google’s serverless cloud storage platform, provides the most flexibility since you can work directly with the data through queries. (More to come on BigQuery in the future!)