

Google Analytics 4 (GA4) offers a lot of new features as compared to Universal Analytics. One of the new additions in GA4 is DebugView mode—a realtime testing interface that helps troubleshoot and test live GA4 implementations. Curious to know how that works? Before we dive into DebugView in GA4, let’s look at the options that were available for debugging and testing in a pre-GA4 world.
Preview Mode – Google Tag Manager
Google Tag Manager (GTM) has a functionality known as Preview Mode, which helps to test tag implementation and validate that the intended data points are captured, tags are triggered as expected, as well as to check whether there are any undesirable implications such as duplicate tags firing and incorrect data being captured. There have been different versions of Preview Mode as the feature went through several product iterations.
However, following are some things to note about Preview Mode:
- Availability limited to GTM interface: GTM Preview Mode can only be used to test the events/tags configured via GTM. Any tags that are not configured using GTM (via another Tag Management System or directly hard coded on the site) will not be visible for debugging purposes in Preview Mode. However, one advantage is that Preview Mode links can be copied and shared with other users enabling them to debug/validate changes without even requiring access to the GTM interface.
- Not an end-to-end testing method: GTM preview testing may not be considered as end-to-end testing since it does not confirm that data will be sent to the analytics properties. For example, if there are any analytics filters that block the event, the event will not show up in the reports.
- Third-party tag testing: Third-party tags configured using GTM can be tested using Preview Mode, however, you will not be able to verify if the data gets actually sent to the respective third-party endpoint. This needs to be validated by looking at destination reports or by using some extensions that are provided by third parties for validation.
Realtime Reports in Google Analytics
Realtime reporting is available in both Universal Analytics and GA4. Using realtime reports, you can view live events, pages being viewed, conversions, device category, and location to name a few data points available. Realtime reporting is very helpful especially to check in real time whether data collected using tags is detected in analytics. This is especially useful for troubleshooting basic tracking issues such as pageview and event tracking (Note that page_view is now an event in GA4).
Test and Raw Views in Google Analytics
In Universal Analytics, properties can be split into views for specific reporting purposes, and one common use case is to set up separate views for the purpose of collecting raw and test data. Usually these are set up as unfiltered views to allow all testing data to pass through to then be used for validations and QA. The thing to note about these types of views is that the standard processing time for data collected can vary between 24-48 hours for standard properties and up to four hours for 360 properties. Hence, these views do not enable realtime testing and are rather a method to perform final QA within reporting. In many cases, they also serve as a backup repository of raw data for debugging during situations where other views may not have captured the required data (for example, due to a faulty filter configuration).
Standard and Custom Google Analytics Reports
Similar to test and raw views, standard and custom reports in Google Analytics are the final endpoints that can be used for testing purposes. The standard processing time applies here as well. Validations using standard/custom reporting will help ensure that user behavior data is captured in the correct format as intended (for example, confirmation whether all associated parameters are captured along with an event in final reporting).
All of This to Say …
Are we implying that DebugView in GA4 is “the knight in shining armor” to fix all of your testing pain points? Definitely not. Using DebugView as a standalone feature without leveraging other testing solutions such as GTM Preview Mode may not be the best approach as it is more of a method to perform realtime endpoint testing of your analytics implementation—the reporting component. It is also worth noting that DebugView is solely focused on validating data collection for reporting within Google Analytics and not meant for validating any other data destinations.
Overview of DebugView
Here are a few definitive features about DebugView in GA4:
- Available within the GA4 user interface
- Helps to check the incoming data at a very granular level
- Can be used to test events generated directly from the website/app or via GTM Preview Mode (Debug Mode needs to be enabled – more about this coming up below)
- Helps to validate that analytics implementation is as expected
- Reflects the events captured in real time
- Flags general events, conversion events, and error events
- Shows the events in a session along with associated parameters and user properties in a sequential manner
- Can be considered as more of an end-to-end validation step since data collected can be viewed directly in the reporting interface— aka, the final destination
How Do I Send Data to DebugView?
Imagine that you are performing interactions live on the website and in parallel checking if those interactions are captured in GA4. You check Realtime reports to find that your session and interactions are reflected there. But when you check DebugView, you do not see any active sessions. For a moment, you think it is due to some bug or a latency issue.
However, it may not be a bug. All event data does not get sent to the DebugView section by default and hence you need to flag to Google that you intend to see your interactions in a testing environment. This is made possible by enabling Debug Mode. We need to send data to GA4 with a signal that informs Google that it is for testing purposes and that event data needs to be displayed in the DebugView. There are a few ways to do this, depending on which platform you are using:
Google Tag Manager: There are a few ways by which you can enable the Debug signal in GTM.
- The easiest way to enable Debug Mode while using GTM is to enable Preview Mode—any traffic to Google Analytics routed via GTM Preview has a debug parameter by default which will display the results in DebugView automatically.
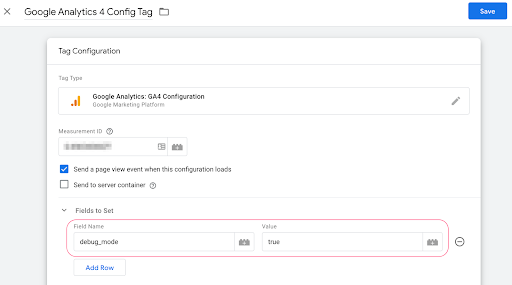
- Alternatively, within the GA4 configuration tag, under “Fields to Set”, you can include the field ‘debug_mode’ with the value ‘true’—this will activate Debug mode for all GA4 event tags that use this GA4 configuration tag.
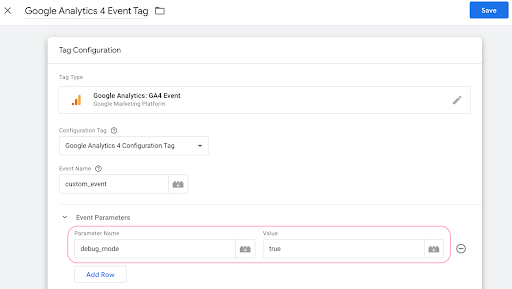
- In case you want only specific events to be captured in DebugView, you may set ‘debug_mode’ to ‘true’ as an event parameter within that specific GA4 event tag.
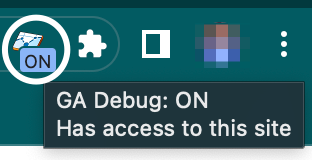
Browsers: While testing interactions directly via the browser, you may use the Google Analytics Debugger Chrome Extension to enable Debug Mode.
For hardcoded events on the site, a ‘debug_mode’:true parameter can be added either to the gtag configuration script or to individual event configuration scripts (to send only specific events to DebugView).
Android: For Android applications, the following command line needs to be executed in a shell or terminal window:
- To enable Debug Mode: adb shell setprop debug.firebase.analytics.app PACKAGE_NAME
- To disable Debug Mode: adb shell setprop debug.firebase.analytics.app .none.
iOS: For iOS applications, use the following command line arguments in Xcode:
- To enable Debug Mode: –FIRDebugEnabled
- To disable Debug Mode: -FIRDebugDisabled
Accessing DebugView within GA4 User Interface
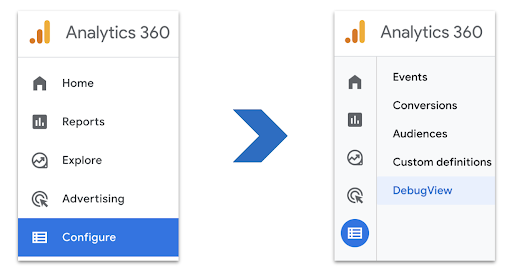
DebugView can be accessed under Configure > DebugView in GA4. Note that DebugView will not show any data if Debug Mode isn’t enabled during a live session.
Components of DebugView
Let’s understand the different components of DebugView:
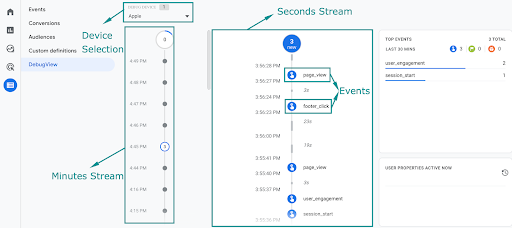
- Device Selector: This dropdown can be used to identify and select the device being used to log debug events for testing. This device should have an active session with Debug Mode enabled. It is typical for DebugView to take a few seconds to show you the active devices so please expect a few seconds of latency in case it doesn’t show up immediately.
- Minutes Stream: This stream shows the time axis in minutes, so with every passing minute you will see this timeline expand. It will also show instances where events occurred (notice where the screenshot shows three events that occurred at 4:45 pm).
- Seconds Stream: In the seconds stream, you can view the actual events that occurred. If you click into an event, you will also be able to see the different event parameters that were captured along with that event. DebugView shows three types of events: General events, Conversion events, and Error events.
Filtering Debug Traffic in GA4
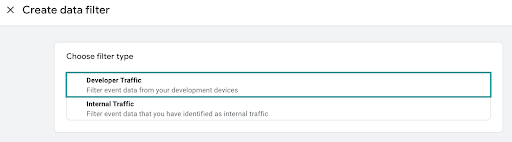
Note that Debug traffic can be filtered out from main reporting in GA4 by enabling Developer Traffic filters which can be accessed under:
Admin > Property Settings > Data Settings > Data Filters > Create Filter
Enabling the Developer Traffic filter will only exclude debug traffic from main GA4 reporting; it will continue to be displayed in DebugView.
With this, you should be all set to explore DebugView in GA4. Happy debugging!