At the intersection of
digital analytics and media enablement, InfoTrust's
privacy-centric solutions drive measurable business outcomes for brands and agencies.
InfoTrust delivers cutting-edge tools with high-value, differentiated solutions that optimize your marketing infrastructure to accelerate productivity and maximize your ROI.
As the martech world begins preparing for our cookieless, privacy-centric future, Google has responded with their own platform updates to address consumer concerns and government privacy laws: Google Analytics 4 (GA4). But what does that mean for the future of Universal Analytics (UA)? First and foremost, hopefully by now you have your website(s) dual-tagged with both UA and GA4, especially since UA is only a year away from deprecation. Second, this means it’s absolutely time to start digging into the GA4 UI and beginning to understand the substantial platform updates. For many, change is not pleasant, and when you first log into GA4, you have every reason to be concerned. Where are all the UA standard reports you know and love? Google has included a few of them as out-of-the-box reports, but many require you to utilize their new Explorations tool, which according to Google is “a collection of advanced techniques that go beyond standard reports to help you uncover deeper insights about your customers’ behavior.” And while at first it may seem cumbersome, once you start using Explorations we hope you’ll fall in love with them as quickly as we did. For this four part series, we picked our favorite UA reports within “Audience,” “Acquisition,” “Behavior,” and “Conversion” reports, and shared the best ways to recreate them in GA4.
Top Behavior Reports
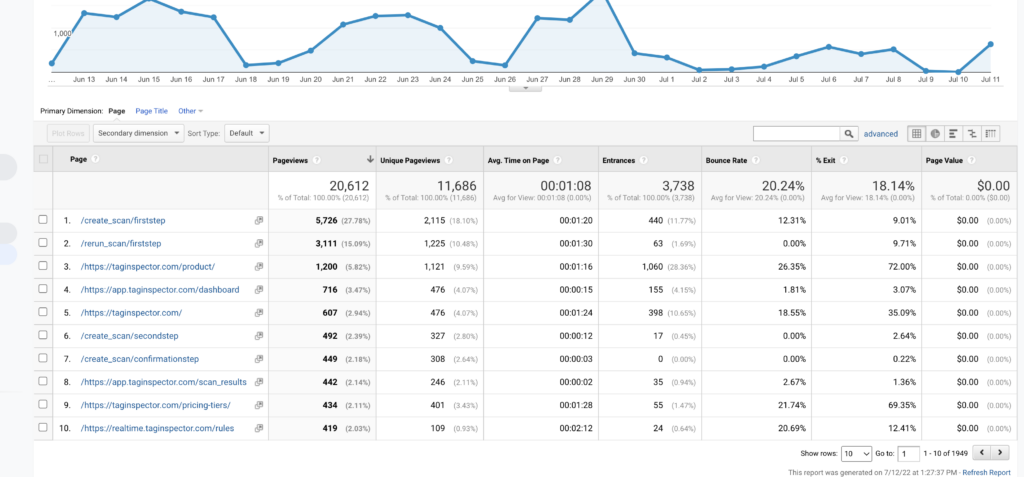
All Pages – This report in UA contains the top visited pages of your website including number of pageviews, unique pageviews, average time on page, entrances and exits, bounce rate, exit percentage, and page value.
UA
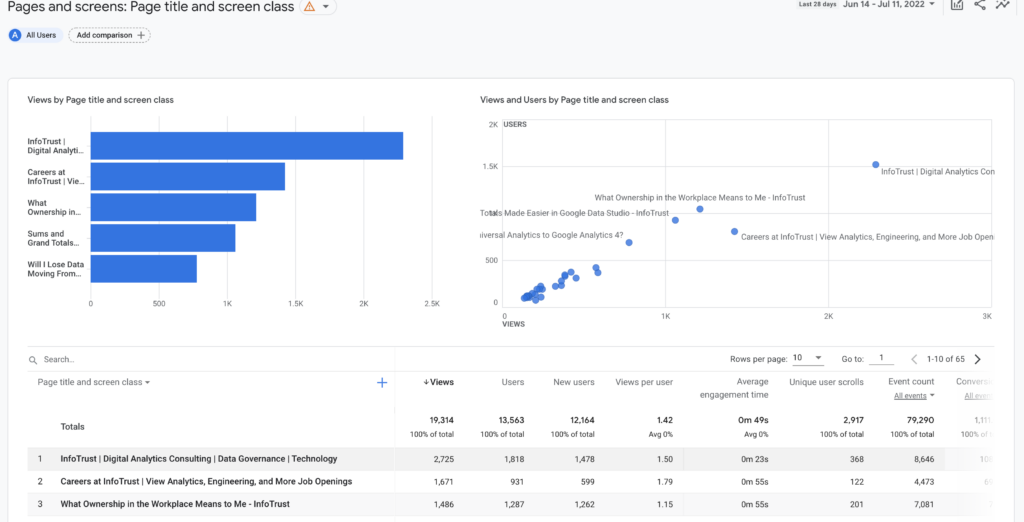
In the standard report interface in GA4 you can find a report similar to All Pages Report. It is now called “Pages and screens” under Engagement>Pages and Screens.
GA4
Average time on page has been replaced with average engagement time. This metric is more useful than average time on page because it is recording engagements per active user. Unique Pageviews has been replaced with Unique User Scrolls. This metric takes unique users who scrolled down at least 90 percent of the page. Exit percentage is not available on GA4; however, it can be replicated in Data Studio. Page value is replaced with conversions and event count.
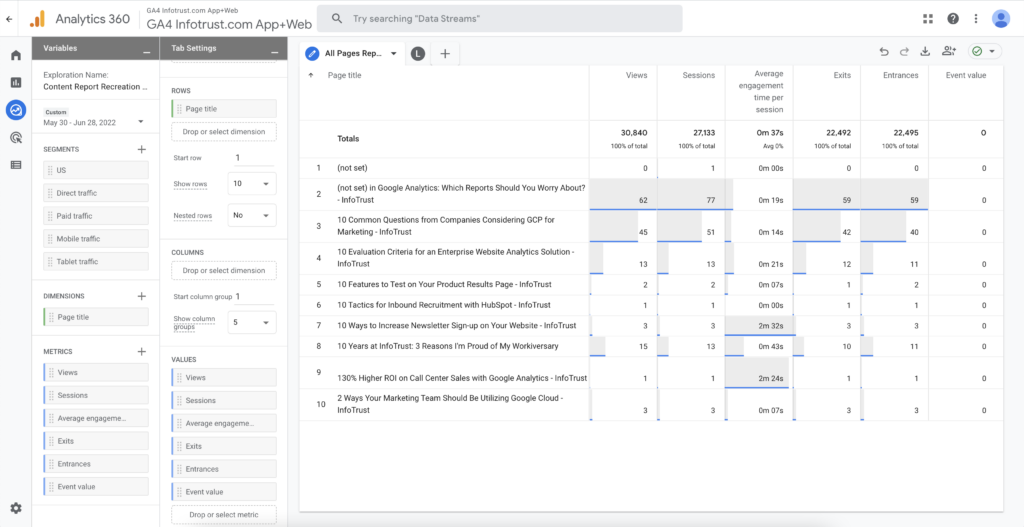
As always, you can create your own report in the “Explore” section of GA4. Some examples to add: User Engagement Rate to replace Bounce Rate and Event Value in place of Page Value.
GA4 Explore: All Pages
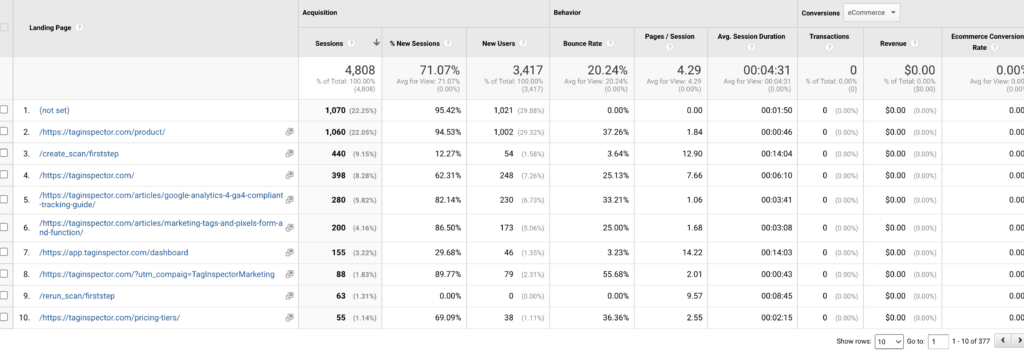
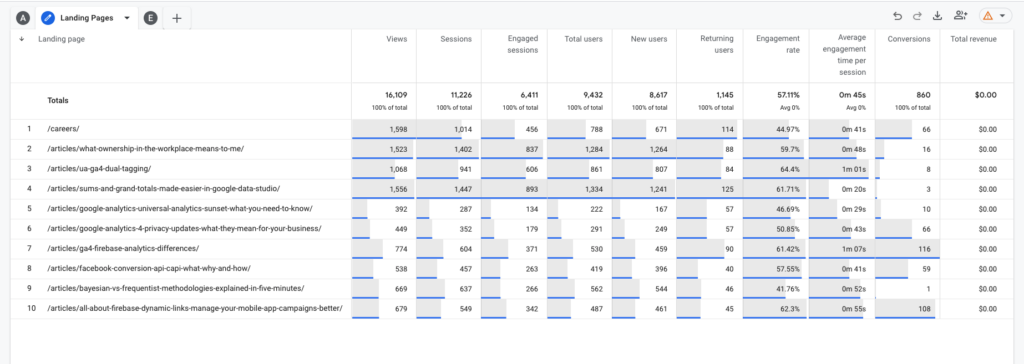
Landing Pages – This report records the pages through which visitors entered your site as well as the breakdown of acquisition, behavior, and conversions. In UA, the landing page report contains metrics that have been replaced by GA4. However, these metrics are more insightful due to increased specificity regarding sessions and engagement.
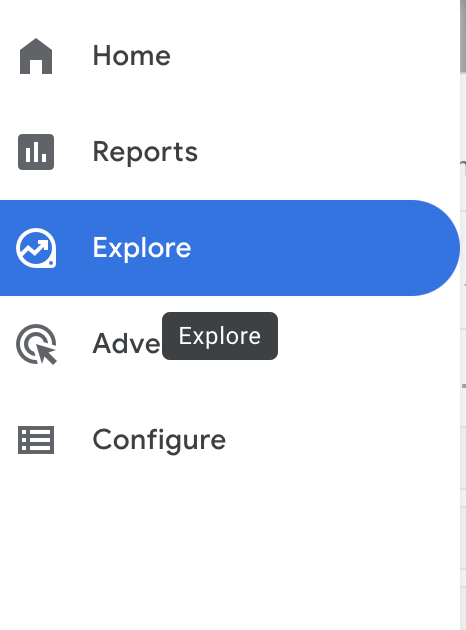
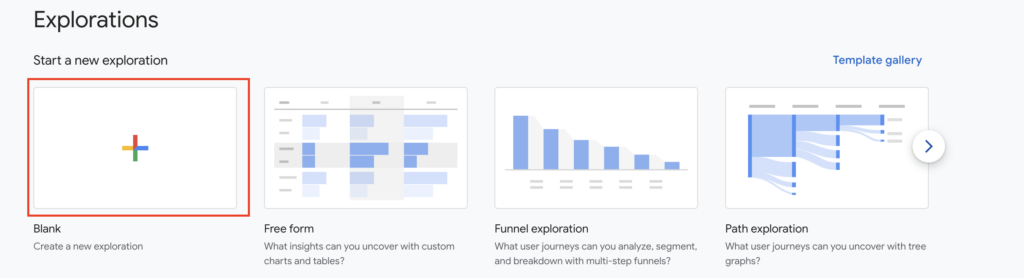
To recreate the Landing Pages report, navigate to “Explore” on the side menu and create a “Blank” report.
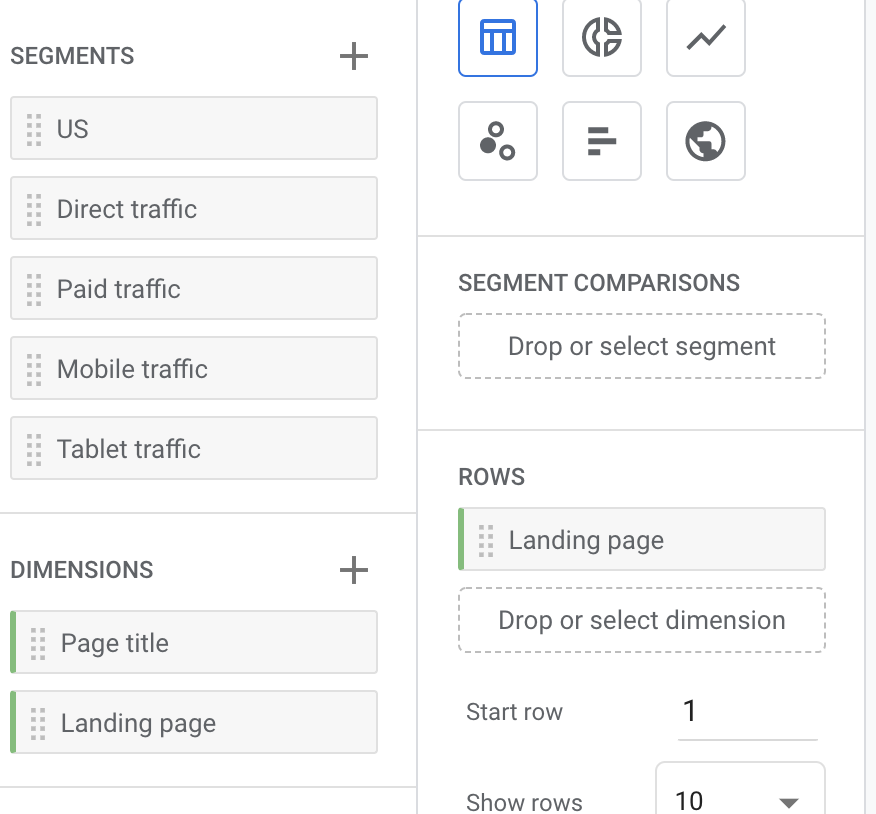
From here, you will add your custom metrics and dimensions. To create the Landing Page report, use the plus sign to add “Landing Page” under dimensions and drag to rows.
For the metrics, do the same by using the plus sign to add the custom metrics: views, sessions, engaged sessions, total users, new users, returning users, engagement rate (replaces bounce rate), average engagement rate, (replaces average session duration) conversions*, and total revenue.
*Conversions in GA4 are specified by a configured conversion event. These conversions are counted for every instance the event is completed. For example, you can set “Buy Now” as a conversion event. If “Buy Now” is clicked twice by a single user, this conversion will be counted twice.
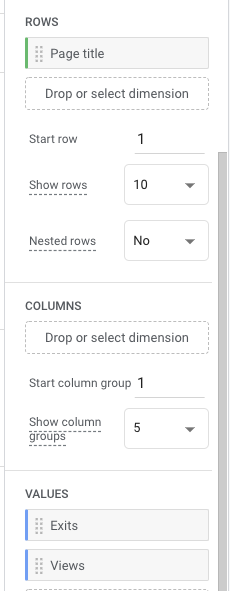
Exit Pages – The exit pages report in UA reports exits per page title, along with pageviews and the exit percentage. As discussed, there is no “Exit percentage” in GA4, but this can be created and calculated in Data Studio. To create the exit pages report, start the explore report the same way as shown for the Landing Pages report. Add “Page Title” into rows and “Exits and Views” into Values.
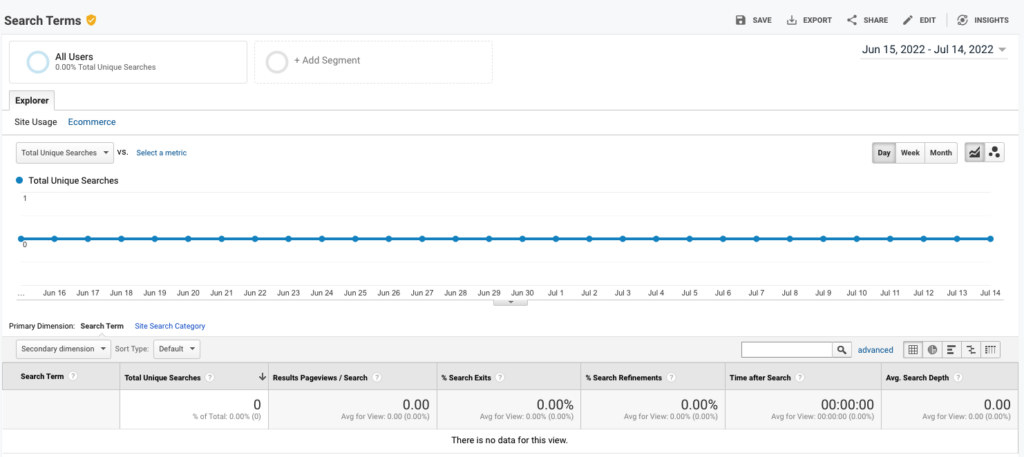
Site Search – Search Terms – This report in UA shows the most searched terms by users on the client’s website. It shows which terms they entered and how the search results created engagement within your website. In UA, this report shows the search term, unique searches, results pageviews/search (“average number of times a visitor viewed a search results page after performing a search.”) % search exits, % search refinements, (“transition occurs between internal search keywords within a session”) time after search, and average search depth.
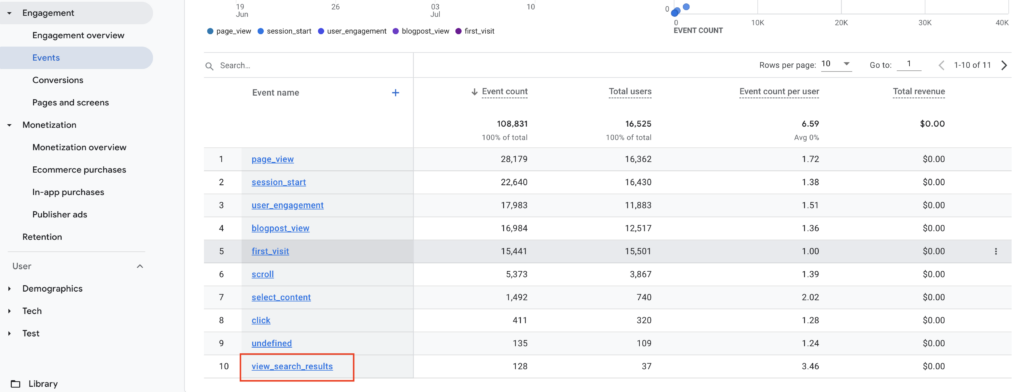
In GA4, there is a report within the UI that has replaced the site search report. Follow Reports>Engagement>Events then under events click on “view_search_results”.
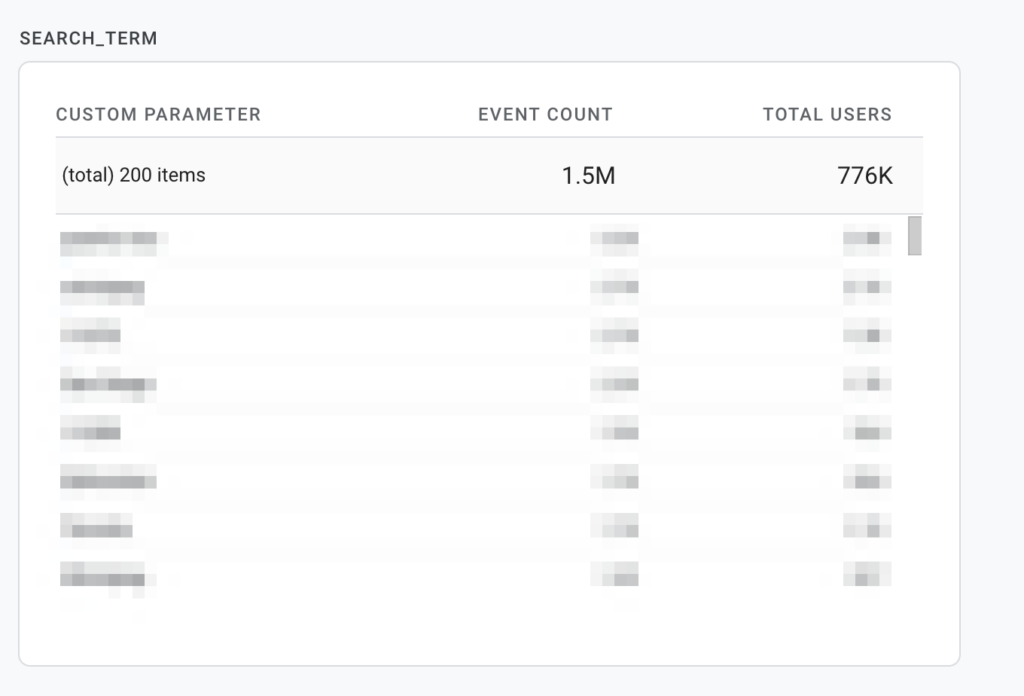
After you click on view_search_results, you will be able to locate the Search Terms tile to find the most popular search terms on the website based on event count and total users.
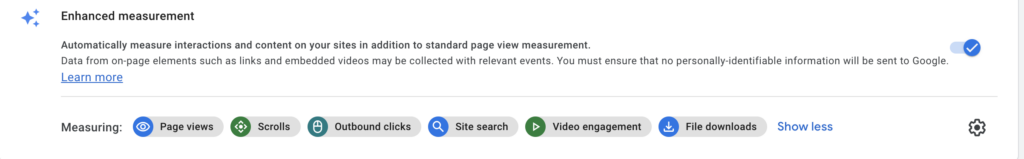
This parameter is featured in the enhanced measurement when you create your data stream for your website.
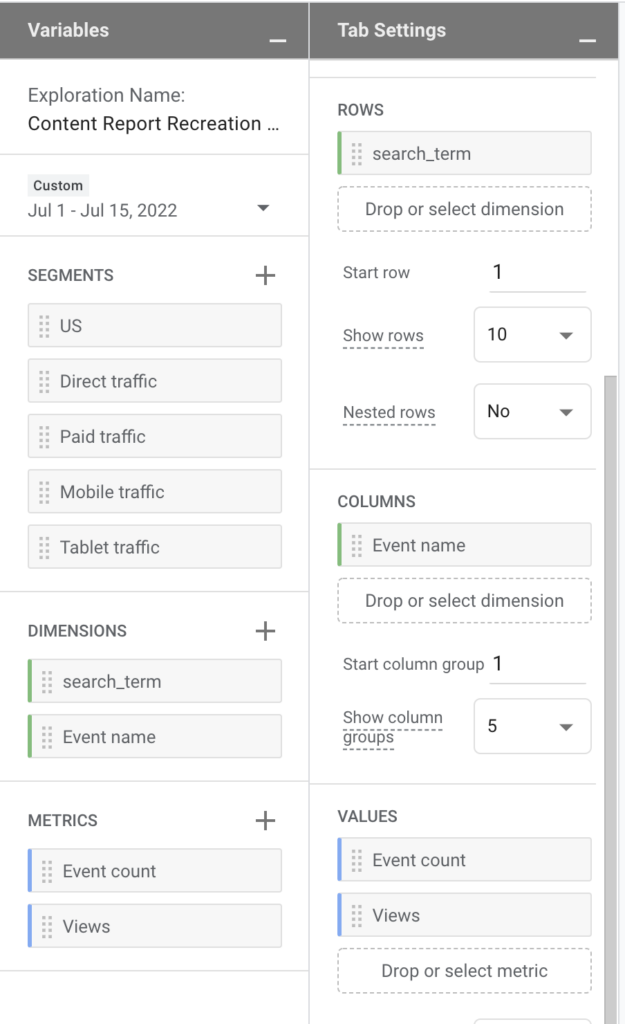
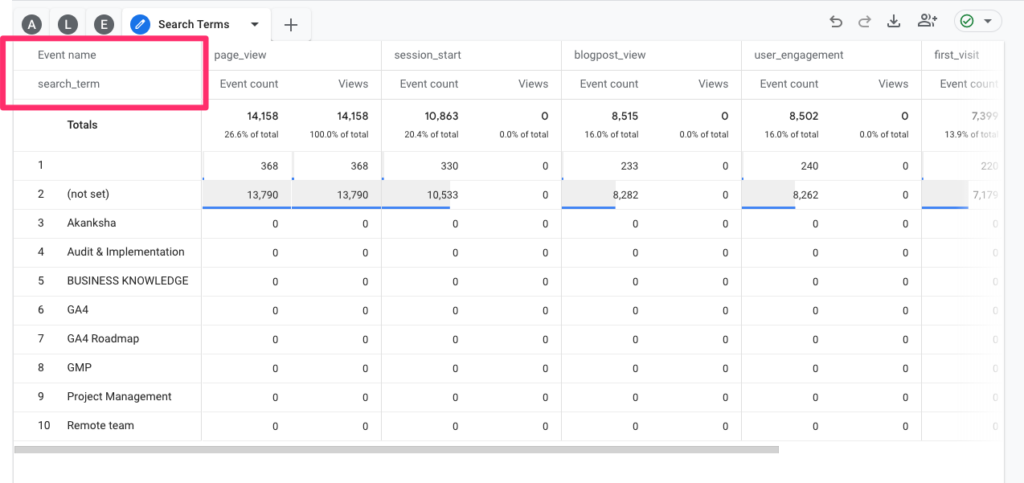
You can also create a custom search terms report in Explore. This report will be more similar to UA. This report will include the search_terms, event count, views, and event names.
This will be set up similarly to the other explorations. However, this time we will include “Event Name” in the Columns section. Place search_term, a custom dimension, in the rows and event count and views in the Values section. Along the left side you will see the search terms from your website. As you move across the rows, you will see how many events fired and their name (page_view, sessions_start, etc.) and the corresponding search term.
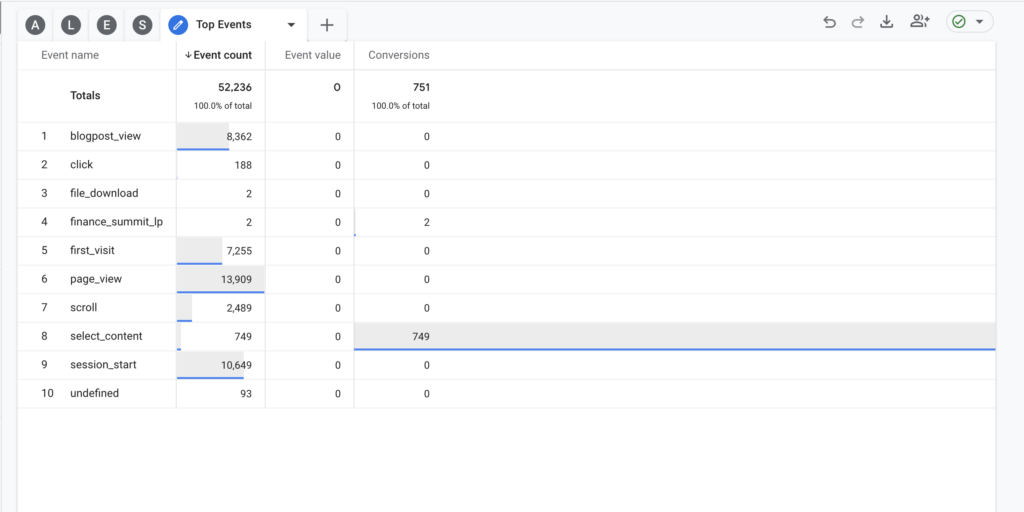
Top Events – This report in UA shows Event Category, Action, and Label along with total events, unique events, event value, and average value. Category, action, and label has been replaced in GA4 by event parameters and in explore by Event Name.
This will show you your top events and their value. Additionally, if any of your events are conversions, you can add conversion to the values section to see how many conversions happened on that event within your time frame.
Need help with your Behavior Reports?
Our team of Google Analytics 4 experts is here when you need us!
Thank you! We will be in touch with your results soon.
Talk To Us
Receive Book Updates
Fill out this form to receive email announcements about Crawl, Walk, Run: Advancing Analytics Maturity with Google Marketing Platform. This includes pre-sale dates, official publishing dates, and more.
Search InfoTrust
Leave Us A Review
Leave a review and let us know how we’re doing. Only actual clients, please.