Introduction
As the martech world begins preparing for our cookieless, privacy-centric future, Google has responded with their own platform updates to address consumer concerns and government privacy laws: Google Analytics 4 (GA4). But what does that mean for the future of Universal Analytics (UA)? First and foremost, hopefully by now you have your website(s) dual-tagged with both UA and GA4, especially since UA is only a year away from deprecation. Second, this means it’s absolutely time to start digging into the GA4 UI and beginning to understand the substantial platform updates. For many, change is not pleasant, and when you first log into GA4, you have every reason to be concerned. Where are all the UA standard reports you know and love? Google has included a few of them as out-of-the-box reports, but many require you to utilize their new Explorations tool, which according to Google is “a collection of advanced techniques that go beyond standard reports to help you uncover deeper insights about your customers’ behavior.” And while at first it may seem cumbersome, once you start using Explorations we hope you’ll fall in love with them as quickly as we did. For this four part series, we picked our favorite UA reports within “Audience,” “Acquisition,” “Behavior,” and “Conversion” reports, and shared the best ways to recreate them in GA4.
Overview
Conversion reports help you understand how the goals on your site and specific actions (ex: transaction) are performing. Conversion goals can be configured in the form of destination (URL) goals, event goals, engagement goals, and smart goals inside UA. Conversion reports are also used in ecommerce reporting. These reports allow you to monitor conversion rates which provide a percentage metric. This metric is produced as a calculation of # conversions / # of total users. For instance, if 300 people come to your site on Friday, and 30 people on Friday perform the goal or action you wanted your user to take, your goal produces a 1 percent conversion rate for that Friday. Simple, right? For more information about configuring goals in Universal Analytics, this article is helpful.

The GA4 equivalent of goals you’ll find inside of UA is a simplification of the earlier UA model. In GA4, there is no distinction between goals and ecommerce. All conversion measurement is performed with the use of GA4 Events. To access conversion reports:
1. Click “Reports” in the far left nav.
2. Click “Engagement” in the nav that shoots from the left.
3. Click “Conversions”.
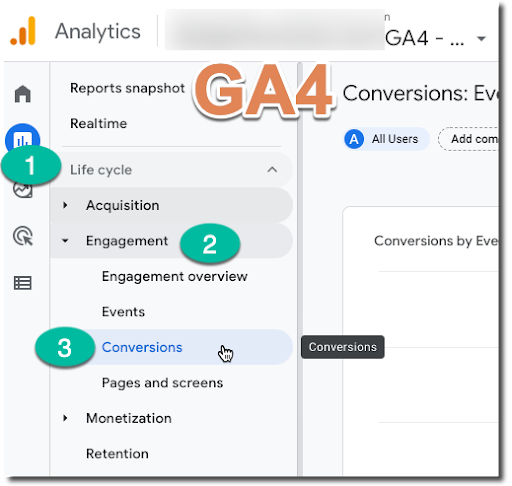
You will need to configure these goals inside of the ‘Configure >> Conversions’ in order to have access to your conversions inside of the Reporting page in GA4.
Goal URLs
Goal URLs can be found inside of UA on the left nav under Conversions >> Goals >> Goal URL.
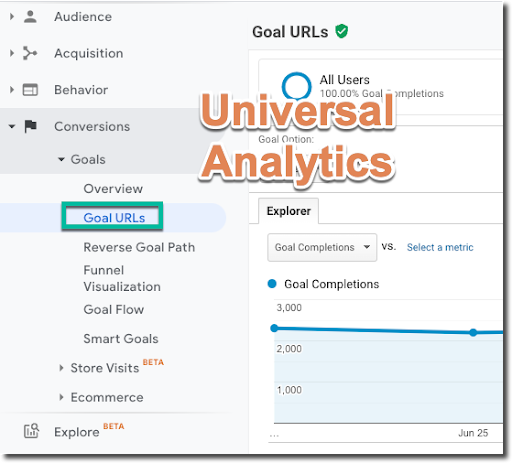
The Goal URL Report is not necessarily a report on page Destination Goals; these Goal URL reports show you the URL or location where the most of any type of goals are being completed.
Inside of GA4, Conversion Events replace “goals”; therefore, the “Goal URL” report does not exist inside of GA4. That said, you can use conversions in the same way. When you want to understand where the majority of goals (or conversions) are occurring, hop on over to the “Explore” part of GA4.
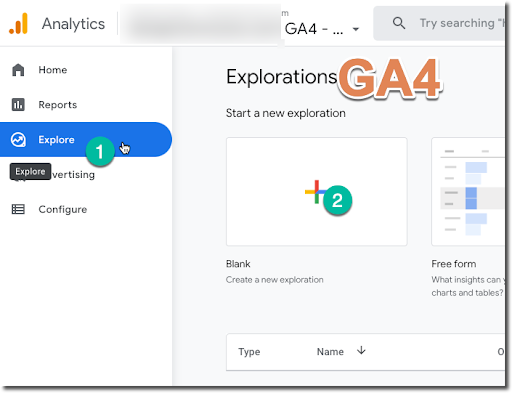
To approximate the “Goal URL” report, select the new “blank” exploration report. There are several ways to configure this for your conversion needs, but in the case of needing a location for your conversions, your report may be built something like this:
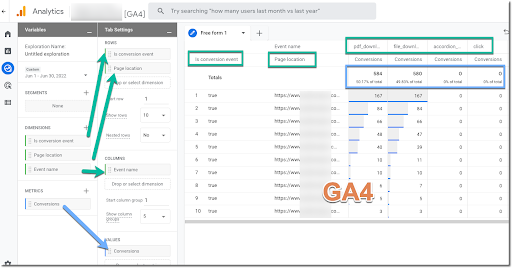
Play around with this report to be certain you have the data you need, but this should give you the same value you were looking for and pulling from the UA Goal URL Report.
Reverse Goal Path
Goal configuration inside of UA provides a report where you can identify what journey users are taking in order to complete a goal on your website. We find this report here:
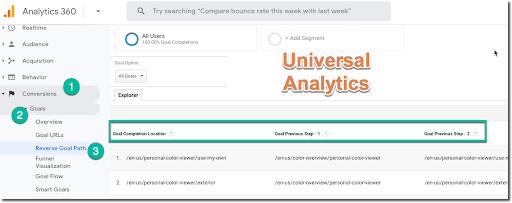
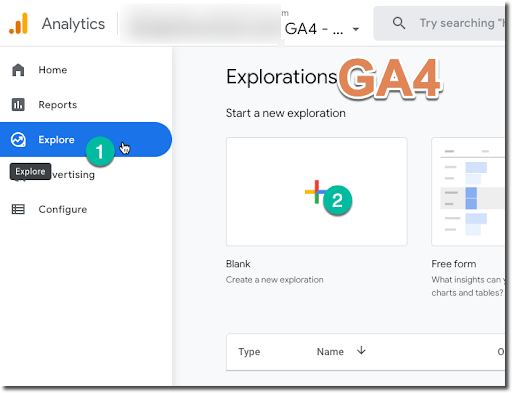
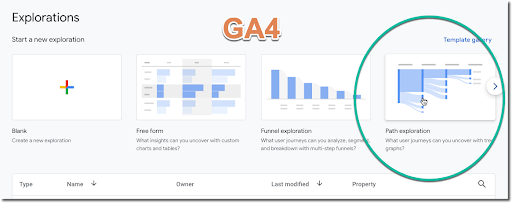
Inside of GA4, we’ll again find that an exploration report will provide us the same value, but with more flexibility. As we did for the goal URL report, we will start with the same steps for a new report. (Hint: you may always start with a ‘blank’ report and configure it, but in this case we have a template already created by Google.)
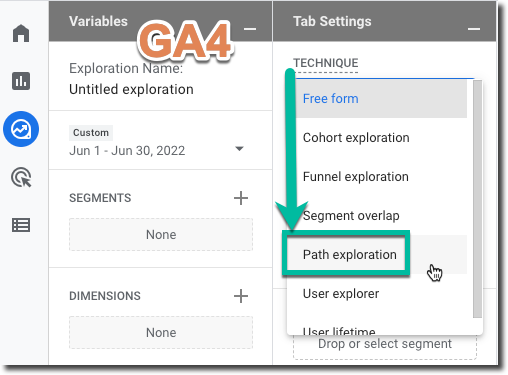
When you reach this report explorer, if you start with a blank report, the first thing we will do is change the “Technique” field to “Path Exploration” like so:
Conversely, you may use the Explorer OOTB template for Path Exploration found here:
The OOTB template provides us with the following configuration:
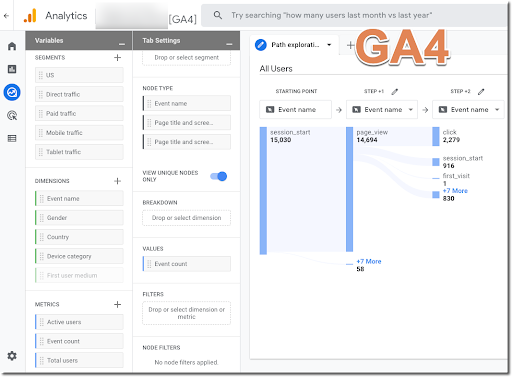
While this does not “reverse” the goal or conversion path a user has taken, any journey may be read in reverse order to achieve the same information regarding a user’s journey to conversion.
Assisted Conversions
Assisted Conversion reports indicate the different roles and contributions within a given channel, as a user makes their way through the user journey (and, ideally, converts). You can access this report clicking the Multi-path Conversion report >> Assisted Conversions:
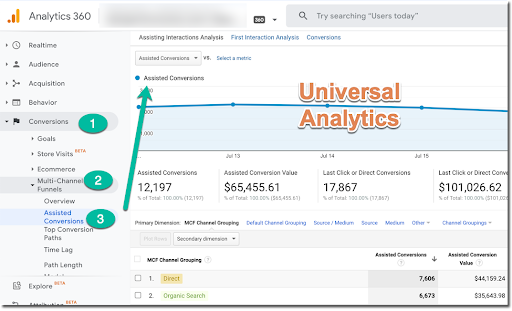
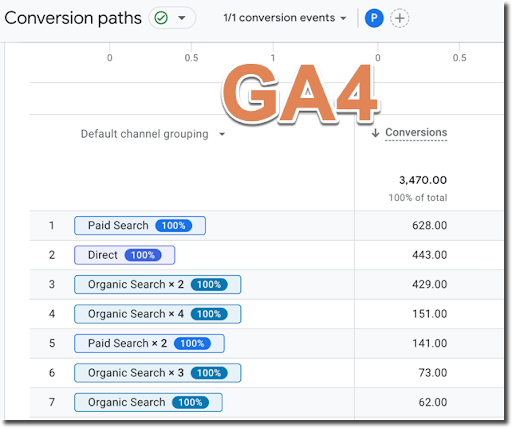
To recreate this report inside of GA4, on the left side of your GA4 reporting interface click Advertising >> Attribution >> Conversion Paths like so:
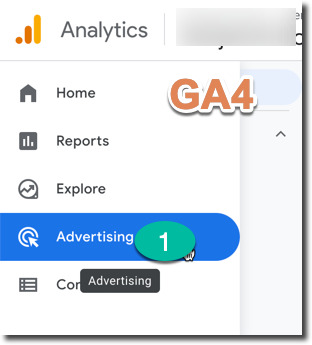
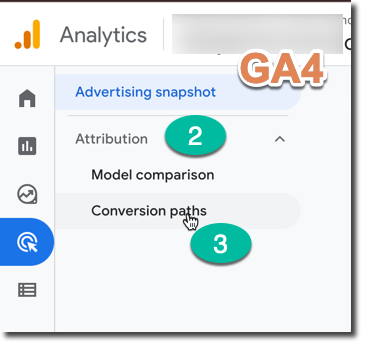
This will provide you with the report you saw above inside of the UA report:
Top Conversion Paths
Another multi-path conversion funnel report is the Top Conversion Paths report. This report will show you the channels your users went through to complete your top conversions.
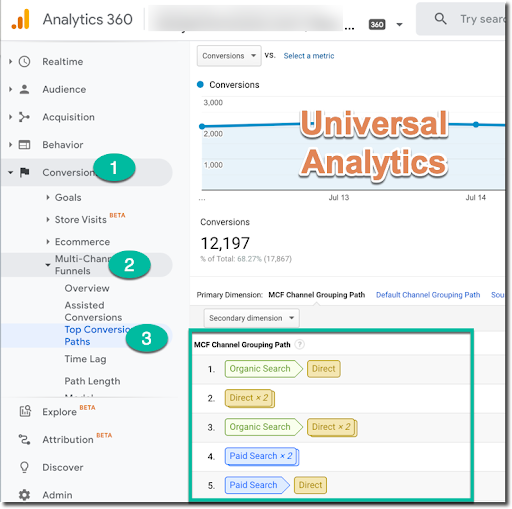
Similar to retrieving the “Assisted Conversions” report above, perform the same steps by clicking Advertising >> Attribution >> Conversion Paths.
As a next step, click on the ‘conversion events’ dropdown at the top of your report.
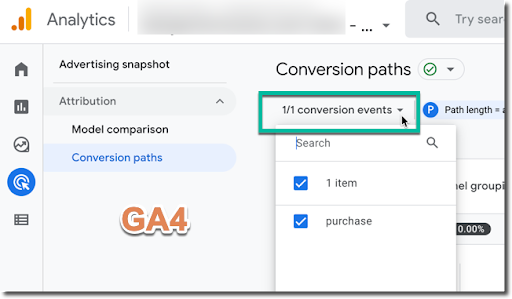
Select or deselect the event(s) for which you would like to see your conversion data. Click “Apply” below your selected items in the dropdown.
Your report should now display the conversion paths for each event you’ve selected.
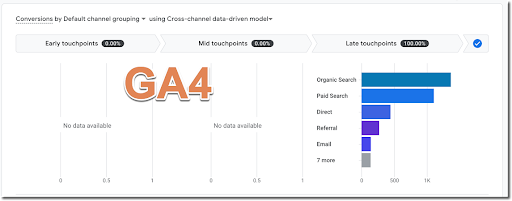
From here you can alter the touch-point length or add other specific filters to your report, depending on your individual needs.

And that’s it! Happy reporting, everyone!

