In our previous post, we looked at translating your events from a Universal Analytics (UA) nomenclature to Google Analytics 4’s (GA4) event-based nomenclature. In order to capture these events and properly use them in reporting, you’ll need to:
- Establish your events in the data layer (or manually with a GTM tag). Note: we always recommend using the data layer to send events.
- Create a tag to handle the events and parameters.
- Test to confirm your events are appearing as intended.
As discussed in our previous post, an event in GA4 consists of the event name and the parameters associated with it. These values can be handled by a tag in GTM to send the user engagement data to your GA4 property. Your tag (using the ‘review_submission’ example from our previous post) might look something like this:
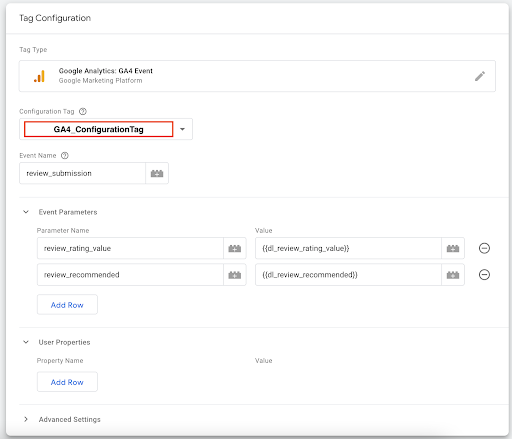
We have our configuration tag referenced, our event name set to “review_submission”, and our two event parameters setup. You’ll see the names are set up based on our translation, and the values are set to pick up whatever values are dynamically sent in our data layer event.
Set up your trigger for this event, and then we can use GTM’s Preview Mode to check our tag. This also allows us to leverage GA4’s ‘debug view’ (more on that in a minute). In preview mode, we can check to ensure the tag is firing as intended, and for the purposes of this article, confirm that our event parameters are populating as intended.
With preview mode open, take whatever action you have set to trigger an event (in this case, submit a review). There are a couple of methods you can use to test, and I always recommend using multiple methods to verify your hits are working. Let’s take a look:
1. Chrome Console Network Tab
For those comfortable with navigating Chrome’s console, you can check your network calls for your event (and every other hit). The event Query String Parameters will show you a lot of info about your hit, and specifically if and how your event parameters are populating:
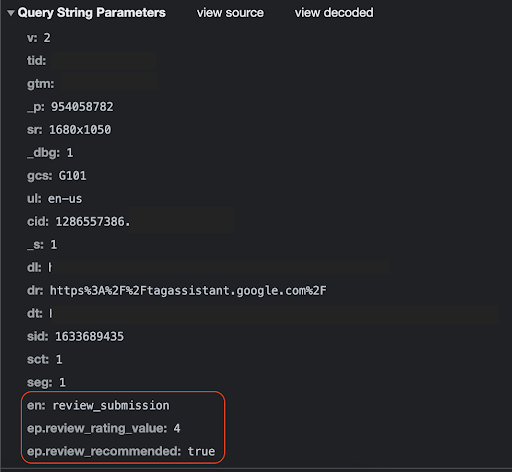
Now that we’ve confirmed the event is firing on our site, let’s head over to our GA4 property to confirm it’s arriving in our reports.
2. GA4 Debug View
GA4 includes a great feature called ‘debug view’ which allows you to check your events in real time. There are a few of ways to enable this feature:
- Use GTM preview mode
- Enable the GA debugger Chrome Extension
- Set a “debug_mode” variable to “true” in your configuration tag in GTM
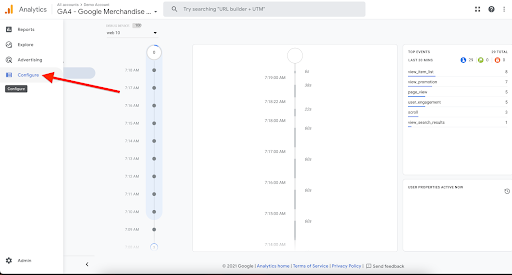
Once you’ve enabled debug view with one of these methods, you can view it in your GA4 property. It’s found under the “configure” menu on the left-hand side:
Once in debug view, you’ll notice all the features it offers:
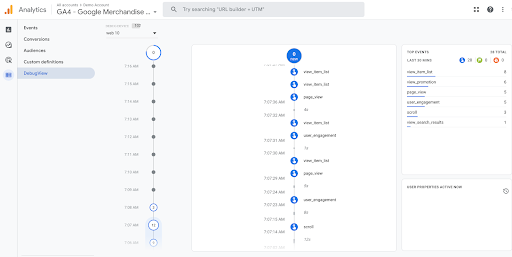
- A minute-by-minute flow of activity (left-hand side)
- A detailed view, second by second of the events triggered (center)
- Event totals for your top events (right-hand side)
The example above is from Google’s demo property, and I highlight that to show you more of what’s available in debug view. For our event, let’s look at our test property and see our event in action:
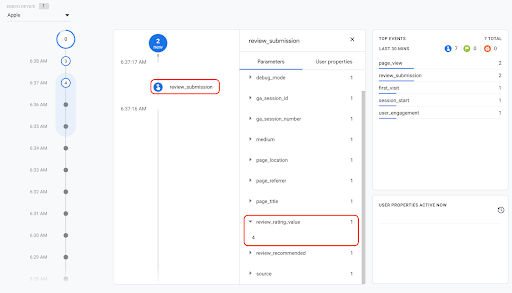
Here we can see the event coming through in our center column, and if we click into that event, we see all the parameters sent with it—including our review_rating_value & review_recommended. If you click the carrot next to the parameter name, you can display the value that’s being sent with the parameter. For review_rating_value, we see that the value is “4”, just like we saw in our Chrome Console. As mentioned in the previous post, you’ll need to register these parameters as custom dimensions in order for them to be available in standard reports in GA4.
That’s just one example of debug view in action—this method can be applied to all of your hits.
As your organization plans to deploy GA4, take advantage of this time in between platforms to translate events, experiment with implementation, test, and learn!


