
You likely have heard about one of Google’s newest products, Ads Data Hub, but you’re probably wondering… “Do I really need another tool?” While advertising platforms can give you a lot of information, they won’t tell you everything. I’m going to show you three ADH use cases for information that goes beyond the data shown in Google’s advertising platforms.
The code examples below use Display and Video 360 (DV360) as the source tables. Organizations interested in Google Ads, YouTube or Campaign Manager will need to tweak the source tables for the code to work.
Use Case 1: Audience Overlap for DV360 Line Items by Device
Problem
How many users fall into multiple line items, insertion orders or campaigns that you are running? What is the percent overlap between Line Item A and B?
Companies often spend a lot of time developing audiences, structuring campaigns and selecting placements for advertisements. After running campaigns, media teams typically go back and review how everything performed and where improvements can be made. How often do you attempt to understand how many users overlap between two different campaigns? Campaigns with a high overlap could mean users are being over-exposed. Depending on your business, this might not be ideal for your return on ad spend.
This is where you can use ADH to understand how users are overlapping for various line items, insertion orders or campaigns.
ADH Query
The SQL code below is looking at one DV360 Insertion Order (insertionOrder1) and three Line Items (A, B, and C). Here we are specifically looking for overlap between the three line items and devices.
To run this code, replace the following values with those found in your DV360 instance.
- insertionOrder1 → Replace with your Insertion Order Id or remove from the query
- A → Replace with your first Line Item ID
- B → Replace with your second Line Item ID
- C → Replace with your third Line Item ID
SELECT
--Decoding the device type from numbers
  CASE
    WHEN device = 0 THEN 'Desktop'
    WHEN device = 2 THEN 'Phone'
    WHEN device = 3 THEN 'Tablet'
    WHEN device = 4 THEN 'Smart TV'
    WHEN device = 5 THEN 'Connected TV'
    ELSE 'Other'
  END as Device,
  imp_A,
  imp_B,
  imp_C,
  --Looking for overlap between two line items and converting that to a %
  round(line_A_B/(imp_A+imp_B-line_A_B)*100,2) AS olPercent_A_B,
  round(line_A_C/(imp_A+imp_C-line_A_C)*100,2) AS olPercent_A_C,
  round(line_B_C/(imp_B+imp_C-line_B_C)*100,2) AS olPercent_B_C,

  FROM(

    SELECT
      device,
      COUNTIF(imp_line_A > 0) AS imp_A,
      COUNTIF(imp_line_B > 0) as imp_B,
      COUNTIF(imp_line_C > 0) as imp_C,
      COUNTIF(imp_line_A > 0 and imp_line_B > 0) as line_A_B,
      COUNTIF(imp_line_A > 0 and imp_line_C > 0) as line_A_C,
      COUNTIF(imp_line_B > 0 and imp_line_C > 0) as line_B_C,

    FROM(
      SELECT
        device,
        imp_line_A,
        imp_line_B,
        imp_line_C,
        line_A,
        line_B,
        line_C,
        FROM (
          SELECT
            user_ID,
            event.dv360_device_type as device,
            COUNTIF(event.dv360_line_item_id = A) AS imp_line_A,
            COUNTIF(event.dv360_line_item_id = B) AS imp_line_B,
            COUNTIF(event.dv360_line_item_id = C) AS imp_line_C,
            SUM(IF(event.dv360_line_item_id = A, 1, 0)) AS line_A,
            SUM(IF(event.dv360_line_item_id = B, 1, 0)) AS line_B,
            SUM(IF(event.dv360_line_item_id = C, 1, 0)) AS line_C
          FROM adh.dv360_dt_impressions
          WHERE user_ID != '0' AND event.dv360_insertion_order_id = insertionOrder1
          GROUP BY user_ID, device
    ))GROUP BY device)
GROUP BY device
Understanding the Outcome
ADH output is stored in the BigQuery dataset and table you indicated when running the query. After the query has run, you’ll see a new (or updated) table. Remember we set up the query to output the data as a percentage, so you should expect to see numbers below 1. Cells above 1 have a large overlap between the two line items.
Example BigQuery Output:
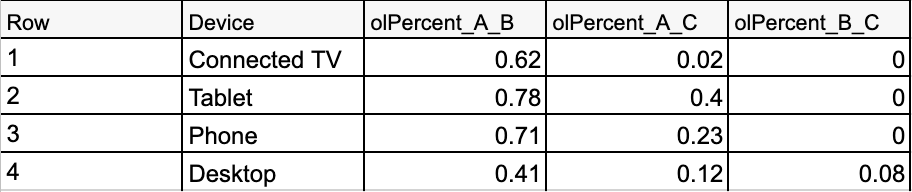
When reviewing your results table, reference how your line items were created and who they are intended to target. Having a high overlap between two line items might not be bad if this is expected behavior. There is no standard for how little overlap is “good”. I’d recommend running your analysis looking back over the last 30-90 days and getting a baseline. From there, set a target overlap below your current baseline.
For example, if you find Line Item A and Line Item B have a 62% overlap, you could target to decrease this overlap to be 45% or less in the next 30 days.
Next Steps
After you’ve reviewed the data and understand your goals, it’s time to start reviewing the line items and advertising setup. Line items with a high overlap might have audiences that were built using similar data or could be targeting similar user behaviors. You’ll need to work with your media team to make adjustments.
Use Case 2: YouTube and DV360 Video Viewability Metrics by Insertion Order and Line Item D
Problem
Determining the viewability of your ads is extremely important. Video ads can be expensive to produce as well as bid on, which means it’s essential to understand if users are seeing the ads and how they are responding to them. We are going to focus on the first challenge. Are users actually seeing the video ads you are publishing?
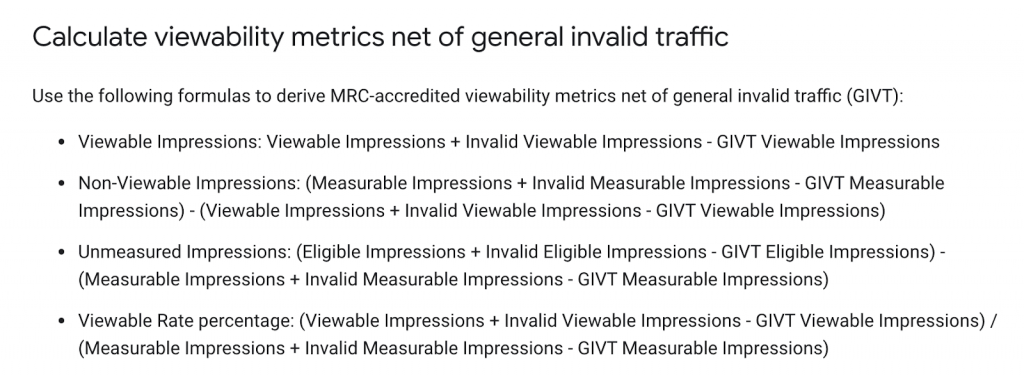
A display ad is considered viewable when 50% or more of its area is visible on-screen for 1 or more seconds. While a video ad is considered viewable when 50% or more of its area is visible on-screen while the video plays for 2 or more seconds. These differences are important to understand when analyzing data with ADH.
Google offers calculations for viewable, non-viewable, measurable and unmeasurable impressions. For full details, checkout their developer page.
ADH Query
The SQL code below will be looking for two insertion order ids (A or B).
To run this code, replace the following values with those found in your DV360 instance.
- A → Replace with your first Insertion Order ID
- B → Replace with your second Insertion Order ID
WITH imp_stats AS (
  SELECT
    imp.insertion_order_id,
    imp.line_item_id,
    imp.adgroup_id,
    count(*) as total_imp,
    SUM(num_active_view_measurable_impression) AS num_measurable_impressions,
    SUM(num_active_view_eligible_impression) AS num_enabled_impressions
  FROM adh.dv360_youtube_impressions imp
  JOIN adh.dv360_youtube_creative cr USING(creative_id)
  WHERE
    imp.insertion_order_id = A
    OR imp.insertion_order_id = B
    AND imp.inventory_type != 'YOUTUBE_TV'
    AND cr.creative_type != 85 #TYPE_VIDEO_TRUEVIEW_IN_DISPLAY
  GROUP BY imp.insertion_order_id, imp.line_item_id, imp.adgroup_id), av_stats AS (
  SELECT
    imp.insertion_order_id,
    imp.line_item_id,
    imp.adgroup_id,
    SUM(num_active_view_viewable_impression) AS num_viewable_impressions
  FROM adh.dv360_youtube_impressions imp
  JOIN adh.dv360_youtube_creative cr USING(creative_id)
  LEFT JOIN adh.dv360_youtube_active_views av USING (impression_id)
  WHERE
    imp.insertion_order_id = A
    OR imp.insertion_order_id = B
    AND imp.inventory_type != 'YOUTUBE_TV'
    AND cr.creative_type != 85 #TYPE_VIDEO_TRUEVIEW_IN_DISPLAY
  GROUP BY imp.insertion_order_id, imp.line_item_id, imp.adgroup_id
)


SELECT
  insertion_order_id,
  line_item_id,
  num_impressions AS Impressions,
  num_measurable_impressions AS Measurable_impr,
  num_unmeasurable_impressions AS Non_measurable_impr,
  num_viewable_impressions AS Viewable_impr,
  num_unviewable_impressions AS Non_viewable_impr,
  Measurable_rate,
  Viewable_rate,
  CASE
   WHEN num_enabled_impressions > 0 THEN round(num_unmeasurable_impressions / num_enabled_impressions,2)
   ELSE NULL
  END AS Non_measurable_impr_distrib,
  CASE
    WHEN num_enabled_impressions > 0 THEN round(num_unviewable_impressions / num_enabled_impressions,2)
    ELSE NULL
  END AS Non_viewable_impr_distrib,
  CASE
    WHEN num_enabled_impressions > 0 THEN round(num_viewable_impressions / num_enabled_impressions,2)
    ELSE NULL
  END AS Viewable_impr_distrib
FROM (
  SELECT
    insertion_order_id,
    line_item_id,
    num_impressions,
    num_measurable_impressions,
    num_enabled_impressions - num_measurable_impressions AS num_unmeasurable_impressions,
    num_viewable_impressions,
    num_measurable_impressions - num_viewable_impressions AS num_unviewable_impressions,
    CASE
      WHEN num_impressions > 0 THEN round(num_measurable_impressions / num_impressions,2)
      ELSE NULL
    END AS measurable_rate,
    CASE
      WHEN num_measurable_impressions > 0 THEN round(num_viewable_impressions / num_measurable_impressions,2)
      ELSE NULL
    END AS viewable_rate,
    num_enabled_impressions
  FROM (
    SELECT
      imp.insertion_order_id,
      imp.line_item_id,
      SUM(imp.total_imp) as num_impressions,
      SUM(imp.num_measurable_impressions) AS num_measurable_impressions,
      SUM(imp.num_enabled_impressions) AS num_enabled_impressions,
      SUM(IFNULL(av.num_viewable_impressions, 0)) AS num_viewable_impressions
    FROM imp_stats as imp
    LEFT JOIN av_stats AS av USING(insertion_order_id, line_item_id, adgroup_id)
    GROUP BY insertion_order_id, imp.line_item_id
  )
)
Understanding the Outcome
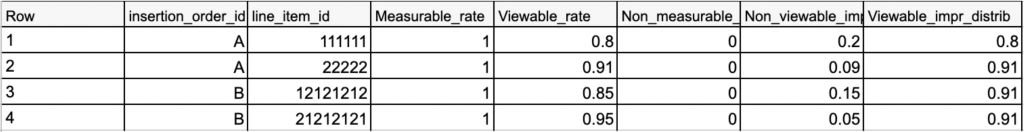
The output from ADH is stored in the BigQuery dataset and table you indicated when running the query. In BigQuery you now have a view by Insertion Order and Line Item of how viewable your ads were. You’ll also see the rate for measurable and non-measurable impressions. For all the rates, you want your measurable and viewable impressions to be close to 1.0 (100%). Note that your non-measurable rate should be low.
Example BigQuery Output:
Next Steps
After reviewing the output from ADH, you might need to make adjustments to the insertion order targeting or placements. Consider adding device breakdowns to the query to better understand what devices might not perform as well. For those with delivery metrics that look good, it’s time to tackle the user engagement piece of video advertising. A good place to start is by understanding how much of the video ad a user is watching.
Use Case 3: DV360 Line Item Impression to Conversion Reporting with Floodlights
Problem
Often advertising can feel disconnected from conversion metrics. With Ads Data Hub, that doesn’t have to be the case. Ads Data Hub allows you to pull metrics such as impressions and click and compare them to your on-site floodlights.
Let’s take a look at a DV360 example: You are running an Insertion Order that’s dedicated to targeting new customers. Through this campaign, you’ve configured a few different line items and after running the campaign, you want to know which line item resulted in more product page views, checkout views and completed transactions. Using ADH you’ll need to join three different tables (Impressions, Clicks and Activities). Use the query below with a few minor adjustments to see your results.
ADH Query
Replace the following values with those found in your DV360/Campaign Manager instance.
- insertionOrder1 → Replace with your Insertion Order Id or remove from the query
- floodlightId1 → Replace with your first floodlight ID
- floodlightId2 → Replace with your second floodlight ID
- floodlightId3 → Replace with your third floodlight ID
WITH
  imp AS (
    SELECT
      event.dv360_line_item_id as lineItemId,
      COUNT(*) as impressions,
      user_id as users
    FROM
      adh.dv360_dt_impressions AS IMPRESSION
    WHERE event.dv360_insertion_order_id = insertionOrder1 AND user_id != '0'
    GROUP BY lineItemId, users
  ), click AS (
    SELECT
      event.dv360_line_item_id as lineItemId,
      COUNT(*) as clicks,
      user_id as users
    FROM
      adh.dv360_dt_clicks AS CLICK
    WHERE event.dv360_insertion_order_id = insertionOrder1 AND user_id != '0'
    GROUP BY lineItemId, users
  ), activity AS (
    SELECT
      event.dv360_line_item_id as lineItemId,
      user_id as users,
      --Counting each floodlight
      COUNTIF(event.activity_id = floodlightId1) AS productPage,
      COUNTIF(event.activity_id = floodlightId2) AS checkoutPage,
      COUNTIF(event.activity_id = floodlightId3) AS transactionComplete,
    FROM
      adh.dv360_dt_activities_attributed AS ACTIVITY
    WHERE event.dv360_insertion_order_id = insertionOrder1 AND user_id != '0'
    GROUP BY lineItemId, users
  )
SELECT
  imp.lineItemId,
  SUM(imp.impressions) AS impressions,
  SUM(click.clicks) AS clicks,
  SUM(activity.productPage) as productPage,
  SUM(activity.checkoutPage) as checkoutPage,
  SUM(activity.transactionComplete) as transactionComplete,
FROM imp
  LEFT JOIN click USING (lineItemId, users)
  LEFT JOIN activity USING (lineItemId, users)
GROUP BY imp.lineItemId
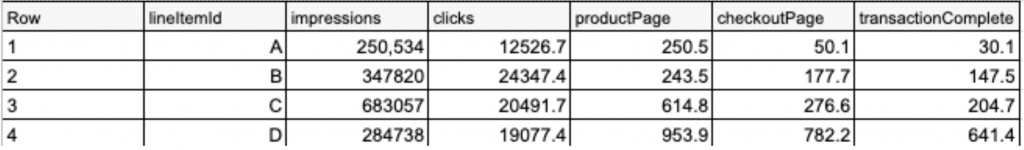
Understanding the Outcome
The output from ADH is stored in the BigQuery dataset and table you indicated when running the query. When you navigate to the table you’ll see Impressions, Click, Product Page, Checkout Page, and Transaction as you indicated in the query. An output like this is perfect for sending to Google’s Data Studio, Looker, or another dashboarding tool.
Example BigQuery Output:
Next Steps
Review the data you pulled and consider sending the data to a dashboarding tool. A query like this is great for ongoing analysis. Businesses should consider setting this query to update on a regular cadence.
Closing Remarks
Ads Data Hub is a powerful tool for advanced advertising analysis. The three use cases here required only ADH and your company’s Google advertising data. As you become familiar with ADH, consider adding first-party data to your queries to create a more robust analysis.
Interested in learning more about Ads Data Hub? Contact InfoTrust today.