

As Google Analytics rolls out GA4, many companies are exploring how the analytics data will appear in BigQuery. BigQuery offers the ability to write custom SQL to pull data and perform advanced analysis. When getting started in BigQuery—or with any new schema—it’s good to do a little testing and quality assurance to validate your data.
To do this, we’re diving into three GA4 reports many of our clients use. We will provide the BigQuery SQL and show you which GA4 report to use for comparison, as well as call out a few “gotchas” we’ve noticed so far. In general, we expect most of the BigQuery and GA4 outputs to align; however, there are times when the two data sources do not match exactly. It’s important to always understand the discrepancy and test to ensure your query is adding and aggregating correctly.
We won’t be reviewing the GA4 schema, but if you are interested I’d recommend bookmarking Google’s BigQuery Export Schema for GA4. Google also offers a variety of other resources including how to set up the GA4 and BigQuery integration, sample GA4 queries, and a sample GA4 dataset so you can practice.
Page Path/Screen Class
GA4 Reporting Path
Engagement > Pages and screens
Purpose
Determine the highest trafficked pages and screens for the data streams in your GA4 property.
BigQuery Query
WITH pages AS (
SELECT
    user_pseudo_id,event_name,
    MAX(CASE WHEN key = "page_title" THEN value.string_value ELSE NULL END) AS page,
    MAX(CASE WHEN event_name = 'page_view' and key = 'page_title' THEN value.string_value ELSE NULL END) AS pageTitle,
    MAX (CASE WHEN params.key = "ga_session_id" THEN params.value.int_value ELSE 0 END) AS sessionId,
    CASE WHEN event_name = "first_visit" then 1 else 0 END AS newUsers,
    MAX((SELECT value.string_value FROM UNNEST(event_params) WHERE key = 'session_engaged')) as sessionEngaged,
    MAX(CASE WHEN key =  "engagement_time_msec" then value.int_value else 0 END) AS engagementTimeMsec,
    MAX(CASE WHEN event_name = "scroll" AND params.key = "percent_scrolled" THEN params.value.int_value ELSE 0 END) AS percentageScroll,
    -- Change event_name to include any/all conversion event(s) to show the count
    COUNTIF(event_name = 'select_content' AND key = "page_title") AS conversions,
    SUM(ecommerce.purchase_revenue) AS totalRevenue
FROM
  --- Update the below dataset to match your GA4 dataset and project
  `bigquery-public-data.ga4_obfuscated_sample_ecommerce.events_*`, UNNEST (event_params) AS params
WHERE _table_suffix BETWEEN '20210101' AND '20210131'
GROUP BY
user_pseudo_id,
event_name),
-- Extract engagement time,pageCount and eventCount data
pageTop AS (
SELECT
  user_pseudo_id,
  event_date,
  event_timestamp,
  event_name,
  MAX(CASE WHEN event_name = 'page_view' AND params.key = "page_title" THEN params.value.string_value END) AS pageCount,
  MAX(CASE WHEN params.key = "page_title" THEN params.value.string_value ELSE NULL END) AS page,
  MAX(CASE WHEN params.key = "engagement_time_msec" THEN params.value.int_value/1000 ELSE 0 END) AS engagementTimeMsec
FROM
  --- Update the below dataset to match your GA4 dataset and project
  `bigquery-public-data.ga4_obfuscated_sample_ecommerce.events_*`, unnest(event_params) as params

WHERE _table_suffix BETWEEN '20210101' AND '20210131'
GROUP BY user_pseudo_id, event_date, event_timestamp, event_name
),
--Summarize data for average engagement time, Views, Users, viewsPerUser and eventCount
pageTopSummary AS (
SELECT
  page,
  ROUND (SAFE_DIVIDE(SUM(engagementTimeMsec),COUNT(DISTINCT user_pseudo_id)),2) AS avgEngagementTime,
  COUNT (pageCount) AS Views,
  COUNT (DISTINCT user_pseudo_id) AS Users,
  ROUND(COUNT (pageCount)/COUNT (DISTINCT user_pseudo_id),2) AS viewsPerUser

FROM
  pageTop
GROUP BY
  page)
-- MAIN QUERY
SELECT
    sub.page,
    Views,
    Users,
    newUser,
    viewsPerUser,
    avgEngagementTime,
    uniqueUserscrolls,
    conversions,
    totalRevenue
FROM (
SELECT
    page,
    SUM (newUsers) as newUser,
    COUNT(CASE WHEN percentageScroll = 90 THEN user_pseudo_id END) AS uniqueUserscrolls,
    SUM(conversions) AS conversions,
    CONCAT('$', IFNULL(SUM(totalRevenue),0)) AS totalRevenue
FROM
    pages
WHERE page IS NOT NULL
GROUP BY
    page)
-- Sub query to joining summary reports together
sub
LEFT JOIN  pageTopSummary
ON
  pageTopSummary.page = sub.page
ORDER BY
    Users  DESC
Query Output
Using the BigQuery GA4 sample dataset for the time period January 1, 2021 – January 31, 2021, you’ll see these results:
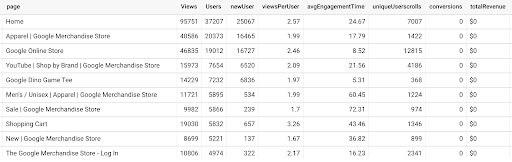
After running the query, you now have a list of all page titles and screen classes sorted by their popularity based on total users visiting the page or screen. From this data you now see which pages might be high value (resulting in revenue), highly engaging (high average engagement time), or bringing in the most new users. These are all areas where you should consider doing further analysis to understand what’s leading these users to convert or why the page is attracting so many new users.
Onsite Events – Pageviews
GA4 Reporting Path
Engagement > Events
Purpose
Report on specific user events that have been defined on your website or app.
Note
The query below is looking specifically for the event name “page_view”. You can modify this event name based on the event names on your website or app.
BigQuery Query
WITH events AS (
SELECT
    event_name,
    (select value.string_value from unnest(event_params) where key = 'page_title') as page_title,
    SUM((select COUNT(value.string_value) from unnest(event_params) where key = 'page_title')) as event_count,
    COUNT(DISTINCT user_pseudo_id) AS user,
    count(distinct case when event_name = 'page_view' then concat(user_pseudo_id, cast(event_timestamp as string)) end) / count(distinct user_pseudo_id) as event_count_per_user,
    SUM(ecommerce.purchase_revenue) AS total_revenue
FROM
    --- Update the below dataset to match your GA4 dataset and project
    `bigquery-public-data.ga4_obfuscated_sample_ecommerce.events_*`
WHERE
    _table_suffix between '20210101' and '20210131'
    -- change event_name to select another event
    and event_name = 'page_view'
GROUP BY
    event_name,
    page_title
ORDER BY event_count DESC)
SELECT event_name, page_title, event_count, user, round(event_count_per_user, 2)as event_count_per_user, total_revenue
FROM events
ORDER BY event_count  DESC
Query Output
Using the BigQuery GA4 sample dataset for the time period January 1, 2021 – January 31, 2021, you’ll see these results:
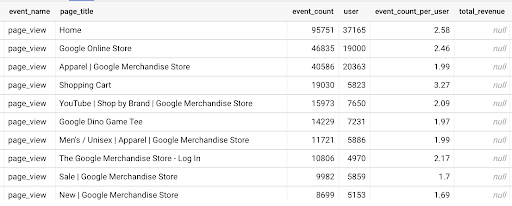
From the output you’ll see how users are engaging with this specific event name. Understanding event interaction can help teams optimize the website and test for future improvements.
Ecommerce Product Reporting
GA4 Reporting Path
Monetization > Ecommerce Purchases
Purpose
Determine what products customers are purchasing, adding to their cart, and viewing which using your website or app.
BigQuery Query
WITH ecommerceProducts AS(
SELECT
--Item name
item_name AS itemName,
--Item views
COUNT(CASE WHEN event_name = 'view_item' THEN CONCAT(event_timestamp, CAST(user_pseudo_id AS STRING)) ELSE NULL END) AS itemViews,
--Add-to-carts
COUNT(CASE WHEN event_name = 'add_to_cart' THEN CONCAT(event_timestamp, CAST(user_pseudo_id AS STRING)) ELSE NULL END) AS addToCarts,
--Cart-to-view-rate,
(CASE WHEN COUNT(CASE WHEN event_name = 'view_item' THEN  user_pseudo_id ELSE NULL END) = 0 THEN 0
ELSE COUNT(DISTINCT CASE WHEN event_name = 'add_to_cart' THEN user_pseudo_id  ELSE NULL END) /
COUNT(DISTINCT CASE WHEN event_name = 'view_item' THEN user_pseudo_id  ELSE NULL END) END  * 100)AS cartToViewRate,
--Ecommerce Purchases
COUNT(CASE WHEN event_name = 'purchase' THEN ecommerce.transaction_id ELSE NULL END) AS ecommercePurchases,
--Purchase-to-view-rate
(CASE WHEN COUNT(CASE WHEN event_name = 'view_item' THEN  user_pseudo_id ELSE NULL END) = 0 THEN 0
ELSE COUNT(DISTINCT CASE WHEN event_name = 'purchase' THEN user_pseudo_id  ELSE NULL END) /
COUNT(DISTINCT CASE WHEN event_name = 'view_item' THEN user_pseudo_id  ELSE NULL END) END  * 100) AS purchaseToViewRate,
--Item purchase quantity
SUM(CASE WHEN event_name = 'purchase' THEN items.quantity  ELSE NULL END) AS itemPurchaseQuantity,
--Item revenue
SUM(item_revenue) AS itemRevenue
FROM
--- Update the below dataset to match your GA4 dataset and project
`bigquery-public-data.ga4_obfuscated_sample_ecommerce.events_*`,
UNNEST(items) AS items
WHERE _table_suffix BETWEEN '20210101' AND '20210131'
GROUP BY itemName)

SELECT itemName, itemViews, addToCarts,
cartToViewRate, ecommercePurchases,  purchaseToViewRate, itemPurchaseQuantity, itemRevenue
FROM ecommerceProducts
WHERE itemViews > 0 OR itemRevenue > 0
ORDER BY itemViews DESC
Query Output
Using the BigQuery GA4 sample dataset for the time period January 1, 2021 – January 31, 2021, you’ll see these results:
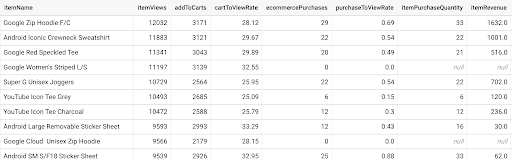
From the output, companies can see what products are being viewed, added to cart, and purchased. The output also provides insights into products that are viewed but never purchased or added to cart and never purchased. After reviewing the data, companies might find areas where they can make website or app improvements.
For additional information, review these:
What is BigQuery and Why Is It Such a Hot Topic?