Intro
For many marketers, their first exposure to Google BigQuery (BQ) is through the integration with Google Analytics (GA). In addition to providing ownership of the complete, hit-level dataset from GA, connecting GA to BQ provides numerous opportunities for analysis, modeling, and activation and can help teams grow in their analytics maturity. In this post, we’ll cover the basic concepts you’ll need to get started analyzing your analytics data in BQ.
Note: This post covers the integrations with BQ for both Google Analytics 360 (GA360) and Google Analytics 4 (GA4), the next generation of GA. When we refer to GA, the information is relevant for both platforms; when there are differences between the platforms, we’ll call them out explicitly.
For more advanced topics, see our other posts: Data Concepts and How They Apply to BQ, and An Overview of the Benefits of BigQuery. Stay tuned for these upcoming topics: I Just Connected Google Analytics to BigQuery – Now What?, and Getting Started with Audience Targeting using GA Data.
Basics
BigQuery is an enterprise data warehouse within Google Cloud Platform (GCP). Aside from being used to store massive quantities of data, BQ is designed to support both data warehouses and data lakes and provide great performance at scale. For analysts, this means they can query both structured and unstructured data and work more efficiently since it’s possible to query billions of rows within seconds.
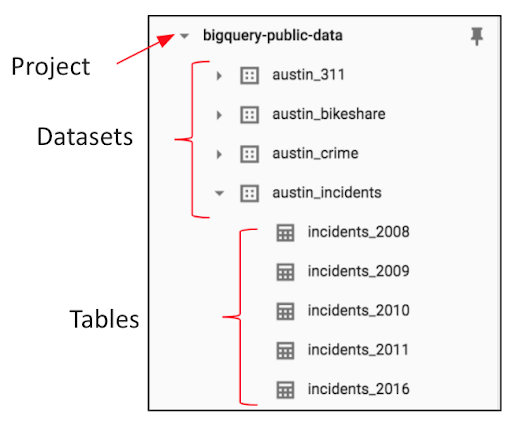
Structurally, BQ has a three-tiered hierarchy of projects, datasets, and tables/views. Across GCP, all actions and configurations must belong to a project, which you can think of as the top-level container. Within the project, you will need at least one dataset to hold the data. Finally, at the lowest level, there are the tables and views. Tables are used to store the data as a set of rows and columns and views are virtual tables defined by an SQL query. To analyze data, you’ll query either tables or views (or both). When setting up the integration between GA and BQ, a new dataset and two tables are created inside your GCP project.
BQ Hierarchy

The actions you take in BQ are called jobs and there are four types: load, copy, query, and extract. We’ll touch on each type of job below.
Permissions
To do any work in BQ, your account needs to have the right permissions. Permissions can be granted at the project or dataset, or individual resource level within datasets. Google provides thorough documentation of the dozens of permissions that exist and the simplified predefined IAM roles. For analysts, we typically recommend being assigned two roles: bigquery.dataViewer and bigquery.jobuser. This gives the account access to see the tables and associated metadata and the ability to run queries against them.
Accessing Data
There are four main ways that you can interact with your data stored in BQ. The most common approach is through the web browser by visiting console.cloud.google.com. Developers can use the bq command-line tool or the BQ API. Additionally, there are integrations with third-party tools such as Data Studio, R, and Tableau.
Billing & Pricing
When you create a new project in GCP, you’ll need to set up a Cloud Billing Account. The Cloud Billing Account is responsible for paying for the services and resources used by the project. However, Google Cloud does have a free tier of service that currently includes 10GB of data storage per month and 1T of query data processing per month.
If your needs exceed the free tier, there are options for how to manage the costs associated with storing and analyzing your data. Storage costs depend on the quantity of data and how recently the data was modified. For tables that have not been modified for 90 consecutive days, storage costs drop by approximately 50 percent. When analyzing data, you can pay on-demand for queries or opt for flat-rate pricing if you are a high-volume customer. If you are streaming data into or out of BQ, there are also costs associated with streaming inserts and streaming reads.
With GA360, if you’ve set up the default export of data to BQ which includes a batch export three times per day, you’ll accrue storage and analysis costs. The default export for GA4 occurs once per day and similarly contributes to storage and analysis costs. For both GA360 and GA4, you have the option to upgrade to a streaming export which will add cost for streaming inserts.
The Four Types of Jobs
Loading & Copying
There are several ways to load data into BQ. You can load data in batches (such as importing a .csv file), via streaming, by using queries to create new data, or through a third-party application or service. The integration between GA and BQ handles loading your analytics data into BQ and new data is loaded into BQ every morning (corresponding to the data from the previous day).
You also have the ability to copy tables in BQ.
Exporting
There are also multiple ways to export data from BQ. From the UI, you can export data to Google Cloud Storage or Google Data Studio. If the table is less than 1GB, you can export it to a single file; otherwise, BQ will export larger tables to multiple files. BQ supports .csv, JSON, Avro, and Parquet file types.
You can also export data using the bq command-line tool, BQ API, or a service like Dataflow. Additionally, you have the ability to export the results of a query (instead of an entire table) by including the EXPORT DATA statement or saving the data directly from the UI.
Querying
As a marketer, you’ll probably spend the majority of your time in BQ writing queries and analyzing the results. Each query produces a result set composed of rows and columns. The easiest way to get started is by running queries from the web browser (console.cloud.google.com) but you can also run queries using the bq command-line tool, BQ API, or third-party tools. From the UI, you can save, share, and schedule queries to run in the future.

Brush Up on SQL
BQ uses its own dialect of SQL called Standard SQL. If you or other members of your team are already familiar with SQL, there’s generally not a steep learning curve. Although there are some features of Standard SQL that may be new or different, most analysts find their previous SQL skills to be very transferable to BQ.
If you need to brush up on your SQL, there are several interactive tutorials from qwiklabs that you can use to get familiar with BQ. Check out BigQuery Basics for Data Analysts and Insights from Data with BigQuery.
Learn the GA Schema
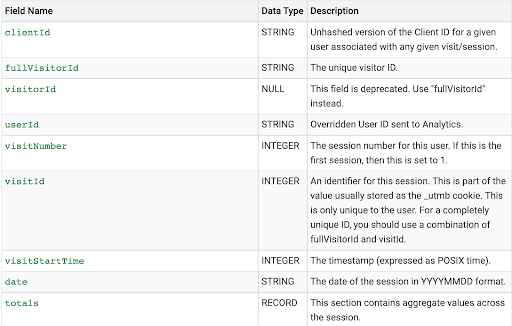
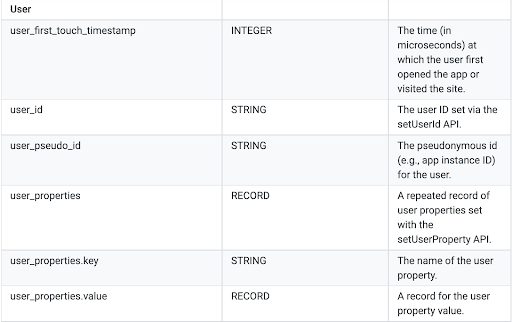
If you plan to work with your analytics data, you’ll need to get familiar with the fields that are exported via the integration with GA. As a first step, we recommend refreshing yourself on how GA collects data, the data model, and some key concepts such as users, sessions, and attribution. Check out the Google Analytics Academy courses (GA360) or playlists (GA4) to brush up on these skills.
Next, review and bookmark these resources from Google to help you get started writing your own queries.


Finally, the real way to learn the schema is by working with it: choose a report or set of metrics from GA, write the query, and compare the results to the GA UI. If they match, congratulations! If not, review the fields you used and the calculations and try again. It’s typically an iterative process and with the instant feedback from the GA UI, you’ll know when you’re headed in the right direction.


