

You’ve probably come across the notion that Google Analytics 4 (GA4) and Universal Analytics (UA) are distinct platforms, despite both being products of Google. Today, I want to delve into one specific aspect with you—the bounce rate—and introduce two fresh metrics that are closely tied to it.
In UA, bounce rate refers to the percentage of single-page sessions in which there was no interaction with the page. A bounced session has a duration of 0 seconds. This definition has changed in GA4, due to the denominator now being engaged sessions, which is a brand new metric.
In the realm of GA4, there’s a new feature called “Engaged Sessions.” It’s like the unsung hero of metrics because it effortlessly fills in based on some simple criteria: if a session hangs around for 10 seconds or more, involves a conversion event, or racks up two or more page or screen views, it gets the “engaged” stamp. Once any of these conditions are met, we consider the session engaged, and from there, it seamlessly factors into the bounce rate calculation. It’s a behind-the-scenes game-changer, making sure our bounce rates are as accurate as they can be! When it comes to capturing user engagement, engaged sessions in GA4 take the spotlight for their accuracy. Unlike the somewhat murky waters of sessions in UA’s context, engaged sessions offer a clearer picture by filtering out potential bot traffic (though both UA and GA4 have bot filtering options, it’s not 100%). It’s like having a sharper lens to focus on genuine user interactions and behaviors, making the analytics game a whole lot more reliable.
Another new metric based on engaged sessions in GA4 is engagement rate. In fact, engagement rate is the inverse of bounce rate and it’s equal to engaged sessions divided by total sessions. By using the new engagement and bounce rate in GA4, many clients have found that their conversion rate has improved. The main reason is due to the real traffic captured and it is more accurate to reflect real users’ behavior.
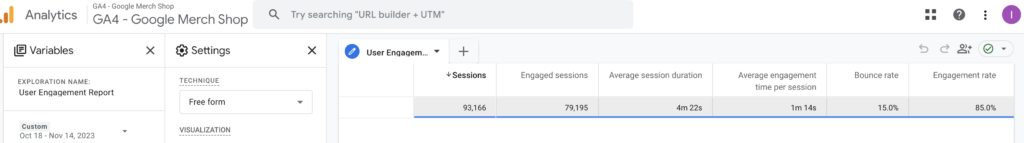
The report above pulls all the metrics we just talked about together from the Google Merchandise Shop account. It clearly shows the differences by using traditional sessions, average session duration versus engaged sessions, and average engagement time per session. Now, more than ever, it’s time to embrace these fresh metrics, allowing us to glean more meaningful insights and stay ahead of the curve in understanding user behavior.