
A typical day in a web analyst’s or digital marketer’s life usually consists of looking at online data or reports. Although we have all of this data right at our fingertips, it can be difficult to pull actionable insights out of our reports. One way is to put the data in context, and the best way to put data into context is to compare a set of metrics in one dimension to a set of metrics in another dimension. Hence, the beauty of the secondary dimension!

What the Secondary Dimension Is and Does
According to Google Analytics support, “The Secondary Dimension feature allows you to define a primary dimension and then view that data by a secondary dimension within the same table.
For example, in the Referral Traffic report, the default dimension is Source. If you select a secondary dimension of City, then you see the cities from which the referral traffic originated.”
This can be extremely valuable when determining anomolies in your data or to better understand what the reports actually mean. In the above example, if you see a huge spike in referral traffic from candy.com, you might wonder why or what is drawing people from that site to yours. By using the secondary dimension set as “Landing page”, you’ll then see what landing pages people from that specific referral source went to. Not only that, you can use advanced segments and/or in line filters and further segment the traffic to pinpoint different marketing campaigns that may or may not be working. It’s a beautiful thing!
Another example of how secondary dimension may be useful is to understand those pesky (not provided) keywords. In a previous post, I described how secondary dimensions can help determine the traffic source of (not provided) keywords. Check that how-to video here:
Ultimately the secondary dimension can paint a better picture about what your data means. As last-click attribution alone might not be the best gauge of your online marketing, looking at only 1 dimension with your metrics and traffic data can be limiting as well.
Pro Tip: Use secondary dimensions as a primary technique, AKA use them ALL the time to get more granualar with your data and become a better analyst!
How to Use the Secondary Dimension
Okay, so hopefully I have convinced you by now how awesome and neccessary it is to use the secondary dimension feature. Next is the easy part, how to bring up the secondary dimension in reports.
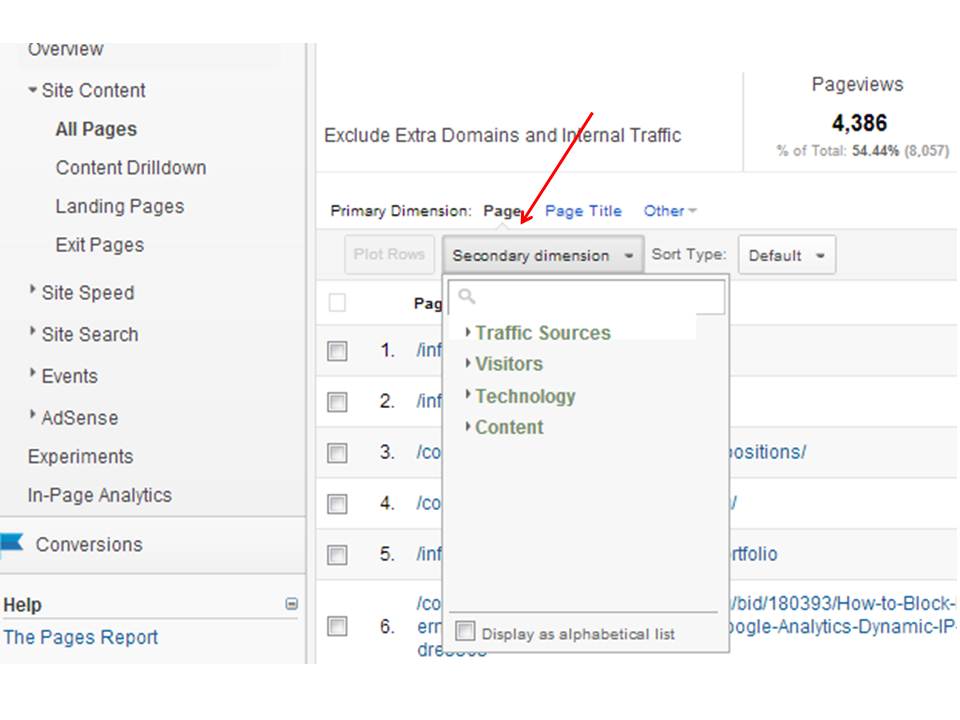
This “how-to” is relatively short because it’s literally only 2 clicks or actions. In your reporting tab, take a look at one standard report provided, for example the “Content-> Site Content -> All Pages” report. All you need to do is click the “Secondary Dimension” drop down tab above the table of data, and input a dimension you want to compare the default dimension to.
Note that some reports, like the Overview reports, don’t include the Secondary Dimension feature, and you do not see the menus.
That’s about it, and now you know how to use the secondary dimension! Here are my top 5 dimension combinations for google analytics standard reports:
- Traffic Source->All Traffic->Source/Medium(primary dimension) + Landing Page (secondary dimension)
This shows top content/landing pages in terms of top sources/medium. - Traffic Sources->Search->Organic->Keyword(primary dimension) + Landing Page (secondary dimension)
This shows top content/landing pages in terms of top organic keyword searches including (not provided) keywords. - Audience->Behavior->New vs Returning->Visitor Type (primary dimension) + City (secondary dimension)
This shows top cities visitors are coming from in terms of new and returning visitor traffic, also shows the difference between various cities. Can explain potentially what new cities should be target markets. - Content->Events->Top Events-> Event Category(primary dimension) + Event Action (secondary dimension)
This is just an easier way to see what specific events are working best, by showing both the category and event action. Most beneficial if you have a lot of event tracking or if you track outgoing links. - Content->Site Content->All Pages->Page (primary dimension) + Visitor Type (secondary dimension)
Again, another critical report to show top content but in regards to what type of visitor. For sites with a “log in” feature, this can prove extra valuable because returning visitors likely will look at different part of the site versus brand new visitors, and content should be modified based off what type of audience is viewing it.
I hope this was helpful as you begin analyzing your web analytics and improve your digital marketing! As always, feel free to reach out to us to learn more about what kind of advanced web analytics services we provide or if you have any questions!