
[Editor’s note: This article is part of our Black Friday series. For a look back on our Black Friday 2019 content, begin here.]
With the holidays under way, eCommerce teams everywhere are focused on collecting good, useable data. Once campaigns start, however, and website traffic reaches peak volumes, most teams want to examine dashboards and insights. How close are we to hitting the goal? How does it compare to last year’s data? Is this low revenue due to an outage somewhere? Should I add more money into this social media campaign?
In short, we all want instant, accurate answers.
Here are some quick and easy tools to monitor your holiday results and extract meaningful, actionable insights from Google Analytics data.
Tap into the Power of Google Data Studio
Google Data Studio lets you create beautiful, informative dashboards and reports that can be easily branded, customized and shared across teams. Empowered with information, your teams can make better decisions.
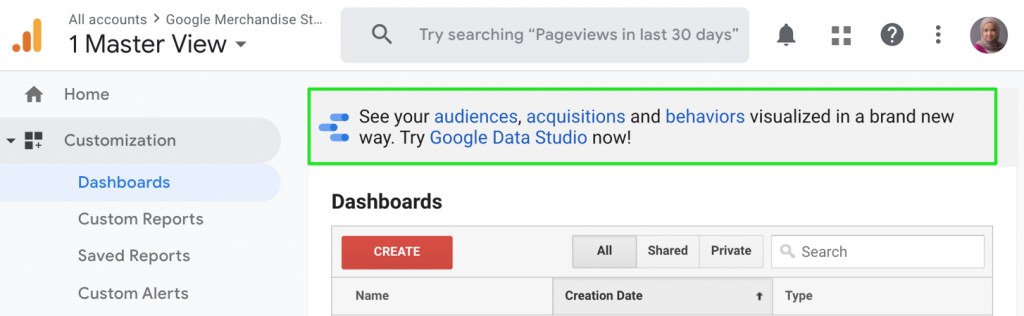
Google provides a shortcut to rebuild and customize some of the built-in audience, acquisitions, and behaviors reports from Google Analytics in Data Studio. Simply go into Google Analytics’ “Customizations” menu and click on “Dashboards”; you’ll see the below notification (highlighted in green) and it will recreate the reports in Data Studio.
In Data Studio, you will need to choose which view to pull the data from (set up a data source); maybe add your logo, tweak the look, and your interactive report is ready to share. Your report audience can choose date range and see how the campaigns are doing.
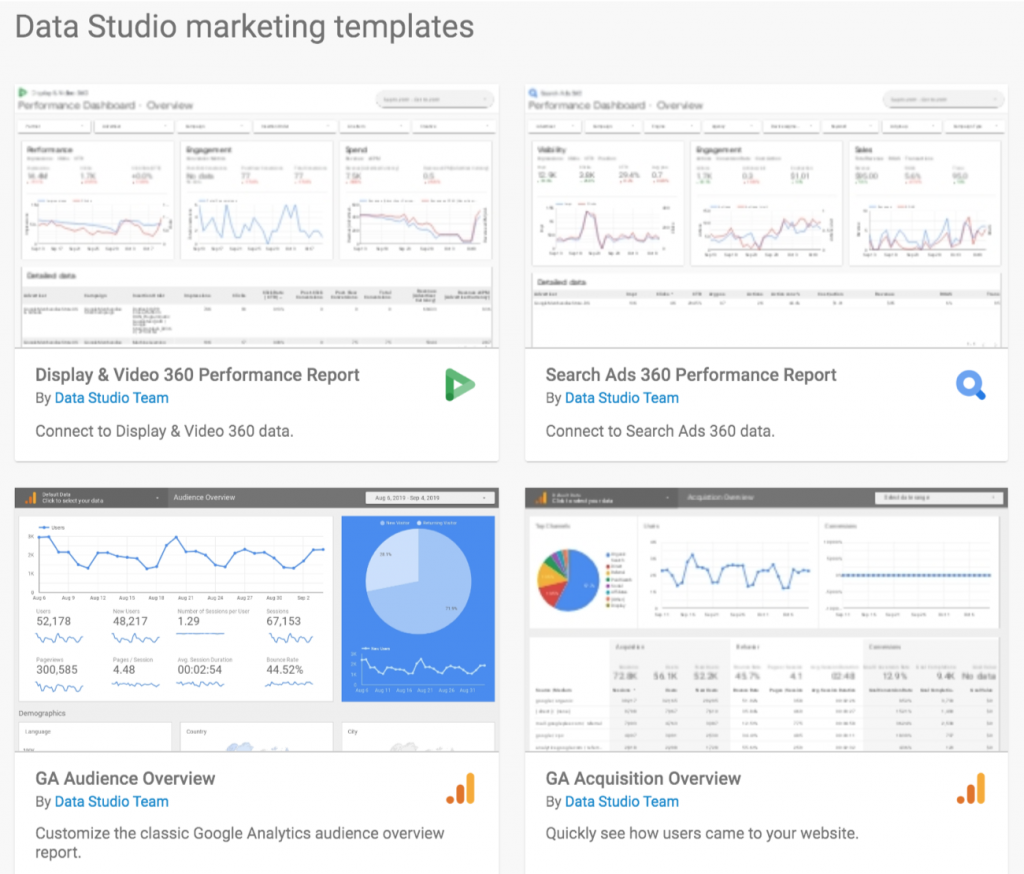
Furthermore, Google Data Studio has ready-made marketing templates that allow you to build your dashboard in seconds. Many teams like to have a separate eCommerce dashboard for each campaign or each marketing channel. The templates aren’t limited to Google Analytics; there are also templates for Search Ads 360, Display & Video 360, and much more.
It takes seconds to pull Google measurement platforms data, including Google Ads spend, YouTube traffic, and everything you’ve set up in Google Analytics (goals, segments, and traffic sources). Additionally, using connectors, you can pull in outside data sources, such as Facebook ad spend. The best thing about Google Data Studio is that it allows the users to import anything as long as it’s in Google Sheets.
Custom Channel Grouping Templates
During the holidays, you may utilize marketing channels you don’t usually use the rest of the year to attract additional traffic. Therefore, you may have additional campaigns in Adwords (or extra social channels), and you want to group them in different ways to look at your conversion data. For example, you may want to see your search campaign group by branded keywords and non-branded keywords, instead of the usual “Paid Search” channel. Moreover, you may want to look at the reports with Google Shopping campaigns as a separate channel from the other paid search campaigns.
We all know that changing your Channel Grouping is not something we want to tweak for the holidays, because the data is permanently changed and it’s not retrospective (whereas using the Custom Channel Grouping will not impact your data, but will let you see the channels in any way you want, and on any report within Google Analytics, including historical data).
For example, I created this Custom Channel Grouping setup to break down my social campaign traffic by Facebook, Twitter, and YouTube instead of the “Social” channel, and broke my paid search campaigns with branded and non-branded keywords, and organic search to Google and non-Google.
This is how it looks when I’m looking at my acquisition report now in Google Analytics:
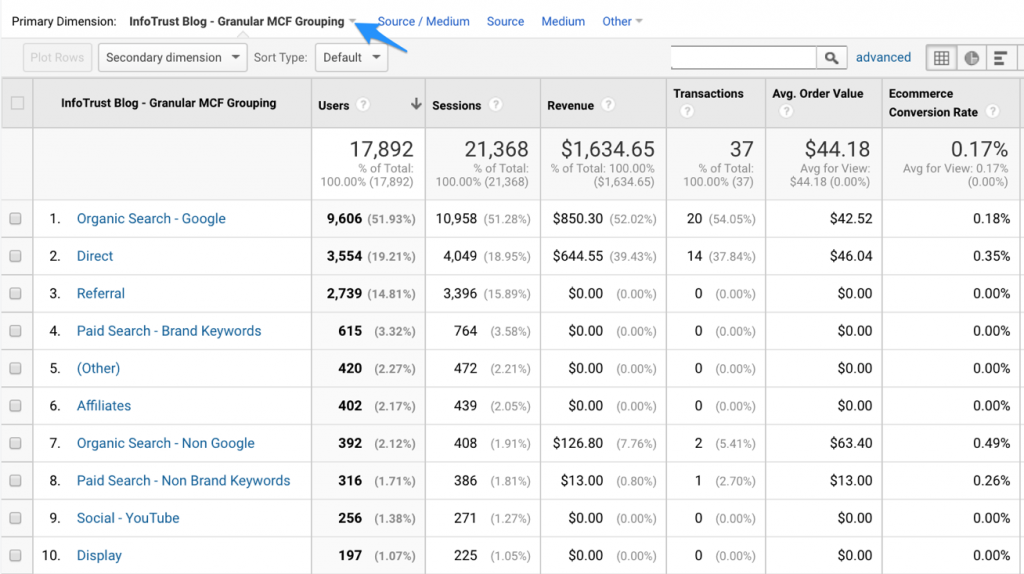
I simply switched the channel grouping from Default Channel Grouping to this custom one I created and named “InfoTrust Blog – Granular MCF Grouping.”
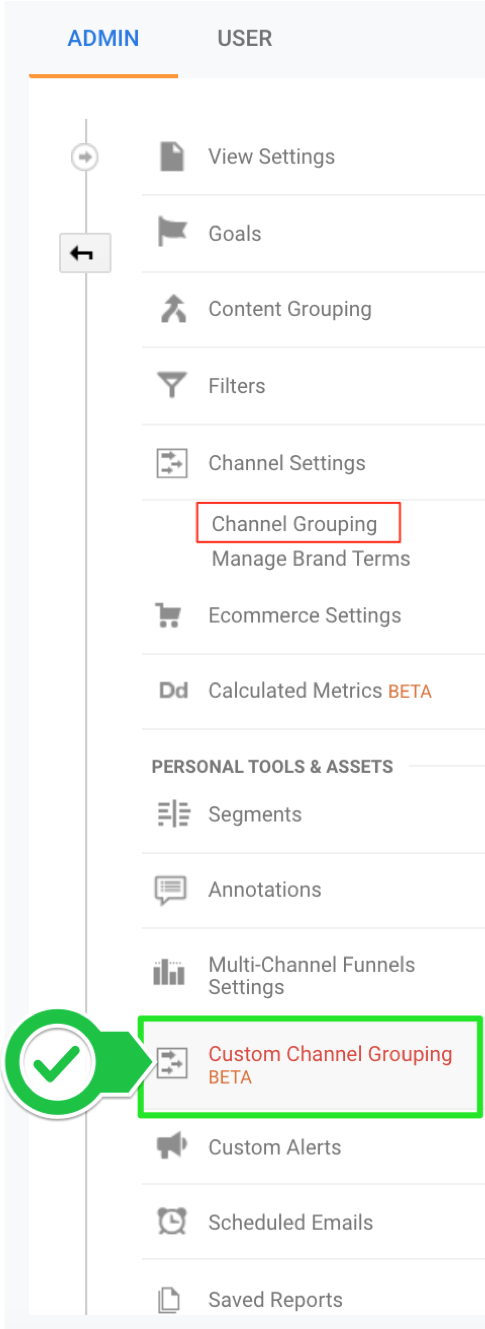
How do you create a custom channel grouping? You can do it from the property settings under Custom Channel Grouping, or you can use this ready-made template that I created, and customize it to your campaigns and reporting requirements.
Just click on this template link below and choose the property where you would like it to be added in.
https://analytics.google.com/analytics/web/template?uid=hjxouffzSwKr4MgvMMHiKw
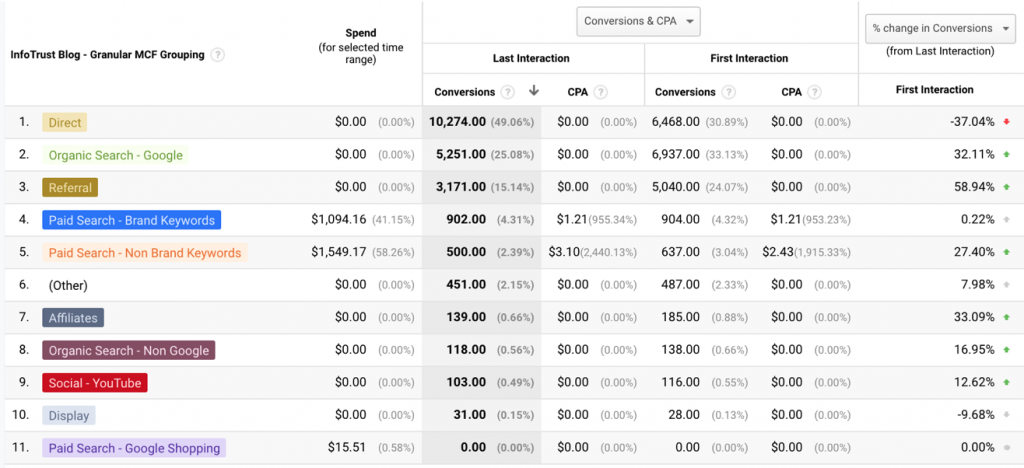
Once you add it, it’s nice to look at the model comparison report (Under Conversions – Multi Channel Funnels). In the example below, we can see that additional spend on non-branded keywords may be worth it, although it looks like brand keywords are bringing more conversions. As you see, the non-brand keywords perform well at first interaction and play a role in initiating new sales and conversions. A follow-up to that insight may be to look at the conversion paths while applying this custom channel grouping.
Speed Reports
New products, promotional banners, landing pages with offers: Your marketing team likely spent significant time preparing for the holiday shopping season. The scary part is, you have no data on their usability and performance, and you’re hoping these efforts bring in more sales. But, what if that landing page with beautiful product images and lovely banners is too slow to load? And that slow experience hinders sales? You might think the products and deals are not good enough, but it’s actually the user experience—and by the time you find out, the holidays are over.
Before launching any pages with new content, make sure you test and optimize them. Google provides a great tool for PageSpeed Insights; it analyzes the content of a web page, then generates suggestions to make that page faster in both web and mobile. This is especially important for the latter, as 53% of visits are abandoned if the mobile site takes more than 3 seconds to load. (thinkwithgoogle.com)
PageSpeed Insights Tool:
https://developers.google.com/speed/pagespeed/insights/
Note that this tool is also linked from the Page Speed reports in Google Analytics interface, but that’s where it shows data from your already-running pages.
Happy Data-Driven Holidays!
According to the 2019 Holiday Preview survey report by Field Agent, more than half of Christmas shoppers surveyed said they are completely likely to purchase gifts online this holiday season; 6-in-10 shoppers are completely or very likely to use a mobile app to assist in their holiday gift-shopping. This produces a wealth of omni-channel data that needs to be crunched quickly for insights and action. With these tools and templates, the holidays will be the most wonderful time of year for data-driven eCommerce professionals.