
In today’s digital marketing world, tracking and analyzing user behavior on your website is crucial for making data-driven decisions. Google Analytics 4 (GA4) is a powerful tool for gathering valuable insights about your site or app, but making sense of this data can be challenging. Also, while GA4 has added extensive custom reporting capabilities with their Explorations feature, their standard reports are a bit lacking as compared to what was seen in Universal Analytics (UA).
Looker Studio, formerly Google Data Studio, a free, user-friendly data visualization tool, can help you gain deeper insights into your GA4 data, while making the whole visualization and reporting process much easier. In this beginner’s guide, we’ll walk you through the steps to visualize GA4 data with Looker Studio.
Step 1: Developing Your Business Questions
It is recommended to lay out the business questions your dashboard will help answer before beginning development of the dashboard itself. This will give you an idea of what metrics and dimensions you need to use in your dashboard. For example, you may need to see conversions by source/medium and campaign. Or you may want to see visits trended over time. List out these questions first and use them to drive your dashboard development.
Step 2: Preparing Your Data
Before you can visualize GA4 data in Google Data Studio, ensure you have a GA4 property set up and running on your site and/or app. If you’re new to GA4, follow the steps in our blog post here: Setting Up Google Analytics 4: A Step-by-Step Guide for Beginners.
Once you have set up your GA4 property, defined your events and custom dimensions, let it run for a few days and then you can start to visualize your data in Looker Studio.
Step 3: Accessing Looker Studio
Sign in to Looker Studio: If you don’t already have a Google account, create one. Then, visit Looker Studio and sign in.
Step 4: Connecting GA4 to Looker Studio
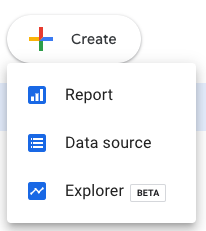
Create a New Data Source: Click on “Create” and then select “Data Source.”
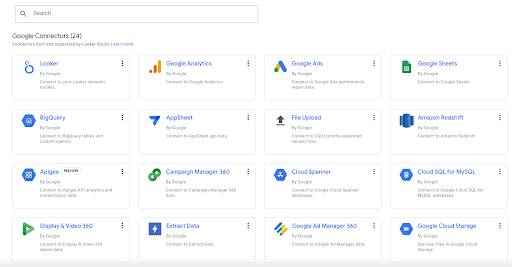
Select GA4 as the data source: In the data connectors list, search for “Google Analytics” and select it.
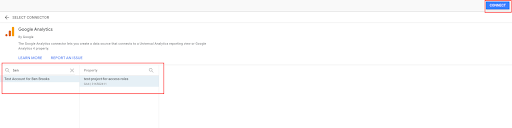
Connect to your GA4 property: Choose your GA4 property from the list and connect it to your Looker Studio account.

Step 5: Building Your First Report
Create a new report: Click on “Create Report”. Alternatively, Click on “Create” and then select “Report.”
Add data source: In the report editor, click on “My Data Sources” and choose the GA4 data source you connected in the previous step.

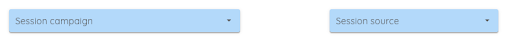
Choose dimensions and metrics: Select the dimensions (e.g., date, page path, source/medium) and metrics (e.g., pageviews, sessions, conversions) you want to visualize.
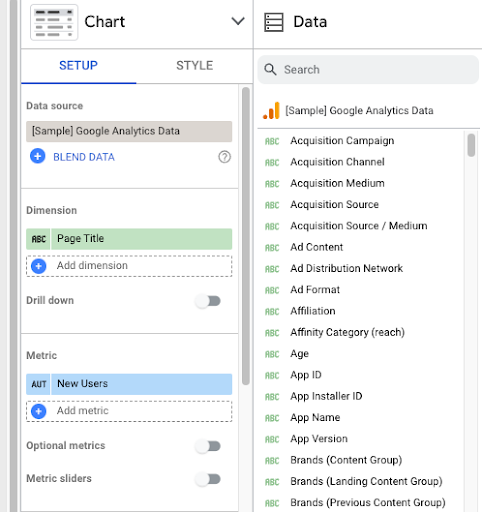
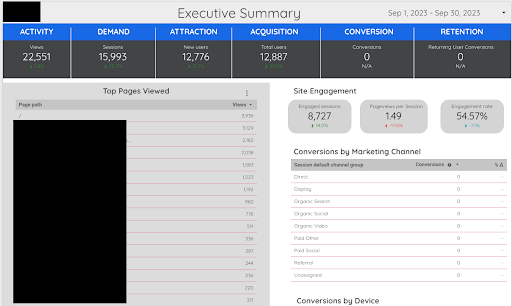
Create visualizations: Drag and drop chart elements onto your report canvas to create visualizations. Looker Studio provides various chart types like tables, bar charts, line charts, and more.
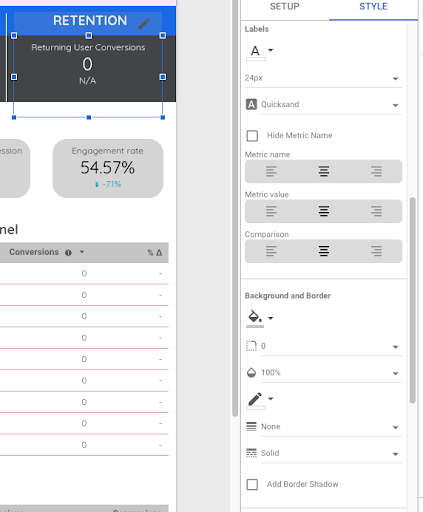
Customize your report: Customize your report’s appearance, including fonts, colors, and styles, to match your brand or preferred aesthetics.
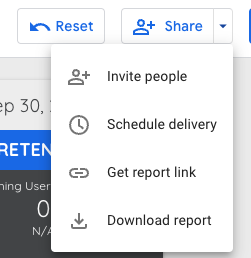
Save and share: Save your report, and use the “Share” button to generate a shareable link. Schedule your report to be sent out, invite other users, and download the report as a PDF.
Step 6: Interpreting and Sharing Your Report
After creating your report, it’s time to interpret and share the insights you’ve gained.
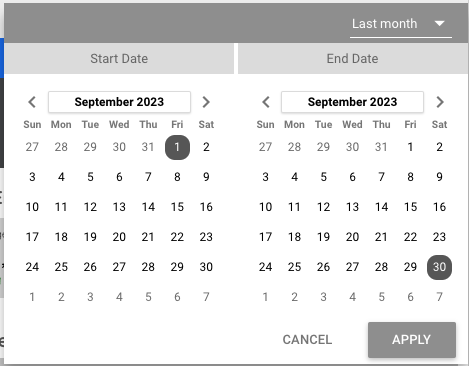
Interpretation: Dive into the visualized data to understand user behavior and website performance. Looker Studio allows you to apply date filters, segmentation, and more to gain deeper insights.
Sharing your report: Use the sharing options in Looker Studio to collaborate with your team and share your insights with stakeholders. You can control who has access to your report, whether via a link, email, or embedding.
Step 7: Continuous Improvement
To make the most of Looker Studio and your GA4 data, consider these best practices:
- Scheduled Reports: Set up scheduled email delivery of your reports to keep your team informed regularly.
- Feedback Loop: Encourage your team to provide feedback on report design and insights. Collaborative refinement can lead to more meaningful reports.
- Explore Advanced Features: As you become more experienced, delve into advanced features such as calculated fields and custom formulas to create more sophisticated visualizations.
Visualizing GA4 data with Looker Studio is an excellent way to gain actionable insights into user behavior and website performance. With this beginner’s guide, you can easily connect your GA4 data to Looker Studio, create informative reports, and share your insights with your team. As you become more proficient, you can explore the tool’s advanced features to create customized and in-depth visualizations that will guide your data-driven decision-making.
Don’t be afraid to try things out; you cannot break your data with Looker Studio. All Looker Studio is doing is reading your data and letting you visualize it. If something doesn’t work (for example, a mismatch of metrics and dimensions) you can always go back and make changes.
Want or need even more? InfoTrust has many experts in data visualization very familiar with Looker Studio who would be willing to help you generate the dashboard of your dreams. Contact us today.
Happy visualizing!
Unlock the power of your data to enhance marketing performance and drive growth. Our experts are ready to answer your questions, uncover valuable insights, and maximize results. Let’s talk—reach out now!