
Introduction
Now that we have migrated away from Universal Analytics, you may be wondering to yourself, “How can I use Google Analytics 4 (GA4) to its fullest potential?” Well, stress no further because the answer to your question is through the use of Explorations. GA4 Data Exploration Reports allow you to uncover hidden insights and opportunities you may not have even known were there.
GA4 leverages machine learning insights and comprehensive visualization of data in Explorations so that users across a range of different roles can collaborate and obtain value from reports. With the ability for marketers and key stakeholders to log onto the platform, there isn’t as much of a need to rely on technical roles to interpret data analysis for opportunity identification. This is a win-win, allowing everyone more time to focus on important business objectives.
What Are Data Exploration Reports?
Data Exploration Reports are interactive reports that allow you to navigate your data in a more flexible and intuitive way than traditional reports. You can use Data Exploration Reports to visualize your data, filter and segment it, and create custom analyses. With customizable dimensions, metrics, and filters, you have the flexibility to tailor your analysis to your specific needs.
The Importance of Data Exploration Reports
In today’s data-driven world, businesses can’t afford to be in the dark about their performance. Data Exploration Reports bridge the gap between raw data and actionable insights, which empower marketers and analysts such as yourself to delve into data with precision. With this tool, you can identify trends, patterns, and correlations that might be hidden beneath the surface.
Examples of Hidden Insights and Opportunities
Understanding Your User Journey
Through funnel exploration, you might uncover a specific sequence of interactions that leads to higher conversion rates. This insight could be used to optimize your user journey for better results.
For example, you run an e-commerce website specializing in gourmet coffee beans and accessories. After setting up your funnel exploration, you notice a significant portion of visitors who initially browse your blog posts on “coffee brewing techniques” then proceed to view product pages for high-end espresso machines, ultimately resulting in a purchase. This specific sequence of interactions might suggest a strong correlation between educational content and higher conversion rates. With these insights, you can strategically enhance your user journey by creating more informative blog posts about coffee brewing methods, spotlighting featured espresso machines, and even offering bundled discounts on these items.
Identifying Your Most Valuable Customers
By using segment overlap to combine data about user behavior and purchase history, you might discover a group of customers with high value. This knowledge can guide your customer retention strategies.
An example of this would be if you run an e-commerce store and you want to know which device was used by visitors in the United States that were recently active and made a purchase. In segment overlap, you can choose the U.S. segments, purchasers, and recently active users for comparison. To go even further, you can select device category and first visit date as your dimensions for breakdowns and the metrics active users, transactions, and gross purchase revenue for your values. From this data, you see that users on desktop devices have a high transaction amount from their first visit date and you decide to tailor your products, services, and marketing efforts to individual customers who prefer using a desktop device.
Finding Areas for Improvement in Marketing Campaigns
Navigating campaign data through cohort exploration might reveal that certain demographics respond better to certain types of content. This can help refine your targeting and messaging strategies.
For instance, you run a blog and want to know the type of content that creates more engagement with users in certain age groups within the United States in order to determine which content to use when targeting a specific demographic. In cohort exploration, create one demographic segment that contains users when their age is one of 25-34 and country ID contains the United States. Now, create another segment you wish to compare such as users when their age is one of 45-54 and country ID contains the United States. After adding those to your segment comparisons, select Cohort Inclusion as First Touch (acquisition date) and your return criteria as user_engagement. Then choose Content Type as your breakdown and Event Count as your value. Once you’ve completed that, you can now see how many users in those two demographics are engaging with specific types of content and use that for targeting strategies in future campaigns or for new ideas for blogs and content creation.
Discovering New Business Opportunities
Path exploration might unveil unexpected trends, such as a rise in demand for a specific product category. This insight could spark the creation of new offerings to cater to this demand.
One example might be that you run an e-commerce business that focuses on the sale of clothing items. You want to know which category of clothing is catering more to your audience’s needs so you set up a page path exploration to see where traffic is going once they land on your website. You set the starting point as an event name and your following steps as page title and screen name and page title and screen class. Within the past month, you notice visitors are spending more time browsing your “eco-friendly fashion” category and there’s a noticeable uptick in conversions for these products. You might consider expanding your inventory of sustainable clothing, collaborating with eco-conscious brands, or launching a dedicated marketing campaign to promote these products.
Here’s how to set up your Explore Report if you still have questions.
Other Pros
Using Filters and Segments: Filters allow you to narrow down your data to specific subsets, enabling more focused analyses. Segments, on the other hand, divide your data into distinct groups, making it easier to compare performance. You could use segments to compare the behavior of new users versus returning ones or use GA4’s Predictive Audiences for AI insights.

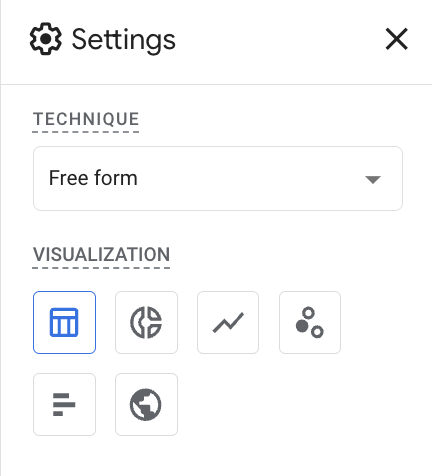
Visualizing Your Data: GA4 offers a variety of visualization options, from line charts to bar graphs. Visual representations of your data can make complex insights more accessible and facilitate quicker decision-making.
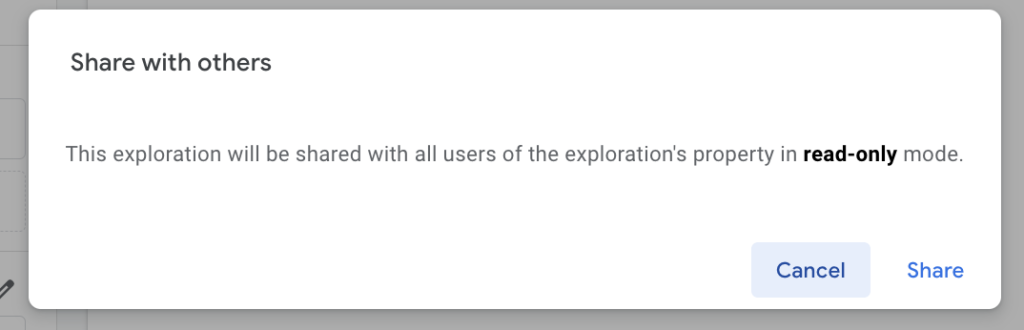
Sharing Your Findings: Collaboration is key to making data-driven decisions. GA4 lets you share your exploration reports with team members, ensuring everyone is on the same page and aligned towards common goals. The only con to this is that when you share a Data Exploration Report, it will be in read-only mode—but hopefully that will change in the future with more users taking advantage of Explorations.
Conclusion
Incorporating GA4 Data Exploration Reports into your toolkit can be a game-changer for your business. These reports transform raw data into customized actionable insights, helping you make informed decisions that drive growth and success. By understanding GA4’s features, creating customized reports, and interpreting the results, you unlock the potential to uncover hidden gems within your data. Embrace the power of data exploration and open the door to a world of possibilities for your business’s future.