

As more users continue to access and leverage Google Analytics 4 (GA4) reporting features, there seems to be one question that is living rent free in most individual’s heads: “We have a specific question we want to answer, but the GA4 Standard Report doesn’t provide us with enough detail and the Explore Reports are too difficult to work with.” If you find yourself asking this question and don’t know where to turn, you have found the right article and InfoTrust is here to help, periodt.
In the last article, we discussed the purpose of the GA4 Explore Report section and which Exploration to use based on various use cases. If you are stuck telling yourself, “This ain’t it, chief” when trying to determine what GA4 Exploration Report will best fit your needs, I highly suggest taking a look at it. This article will be more focused on setting yourself up for success by focusing on some of the core characteristics and features that are found across the various reports.
Variables Column
The variables column contains the Exploration Report level data/settings that can be accessed no matter what Exploration tab the user is on/editing. If you change something in this column, it will be changed across the whole report.
Date Range
You may be thinking, “I know what a date range is. Couldn’t we have started with something a little less intuitive?” If the Explore Report date was the same as the Standard GA4 Report, then I would agree with you. However, there are few unique things to note about the Explore reports date range:
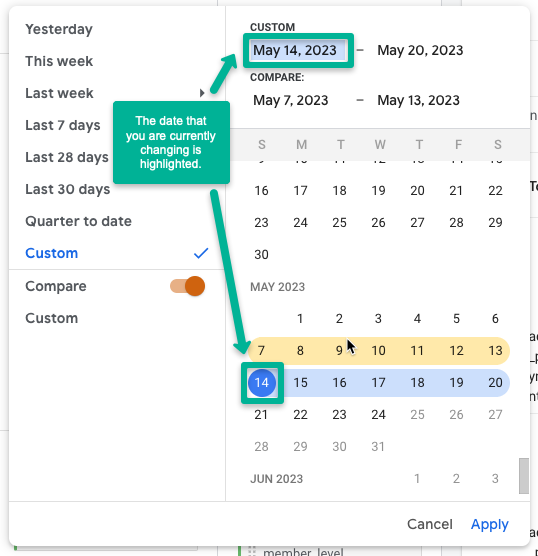
- The first thing to note is the ability to add comparisons to your Explore Reports. The comparison date range for Explore Reports is actually a little more tricky than you will find in the Standard Reports. There isn’t the ability to simply select the, “compare to previous period”. Instead, you will need to select the date range you wish to view as the current date range and then toggle on the comparison date range to easily populate the data from the previous period. If you decide to toggle on the comparison date range before you select the current period you wish to view, just be warned that you may get slightly frustrated.
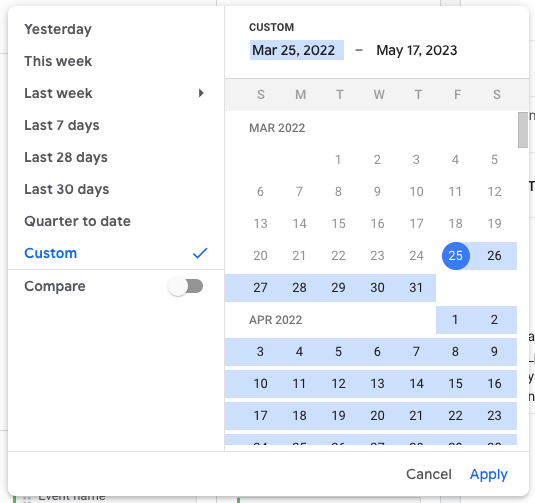
- One thing that is very important to note is the limitations of how far back you can pull data in the Explore Reports specifically. The date range limit is directly correlated to data retention settings (see the example below of a property with data retention set to 14 months) of the property/roll-up/sub-property the Exploration Report is being built in. By default, all newly created roll-ups’, sub-properties’, and properties’ data retention settings are set to two months. Standard licensed organizations have the ability to increase the data retention settings up to 14 months, while GA4 360 licensed organizations and set the data retention setting up to 50 months.
Segments
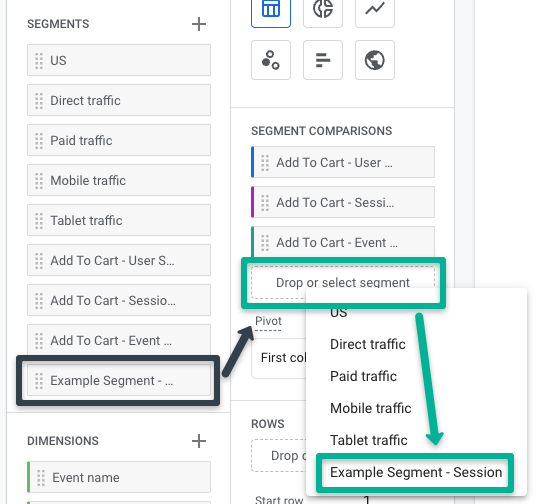
If the date range section turned out to be interesting to you then I can’t wait to discuss segments and give a brief overview of the segment builder. It is first important to note that currently segments can only be accessed and used in the Explore Reports section and within the same Exploration Report. This means that you can’t create a segment in one Exploration Report and use it in a completely separate report. However, you can share the segments amongst various Exploration Report tabs (more to come on Exploration Report tabs later in the article).
In the Exploration Report, you can create up to 10 segments and there are two ways to do so. Both of these ways are dank depending on the desired outcome:
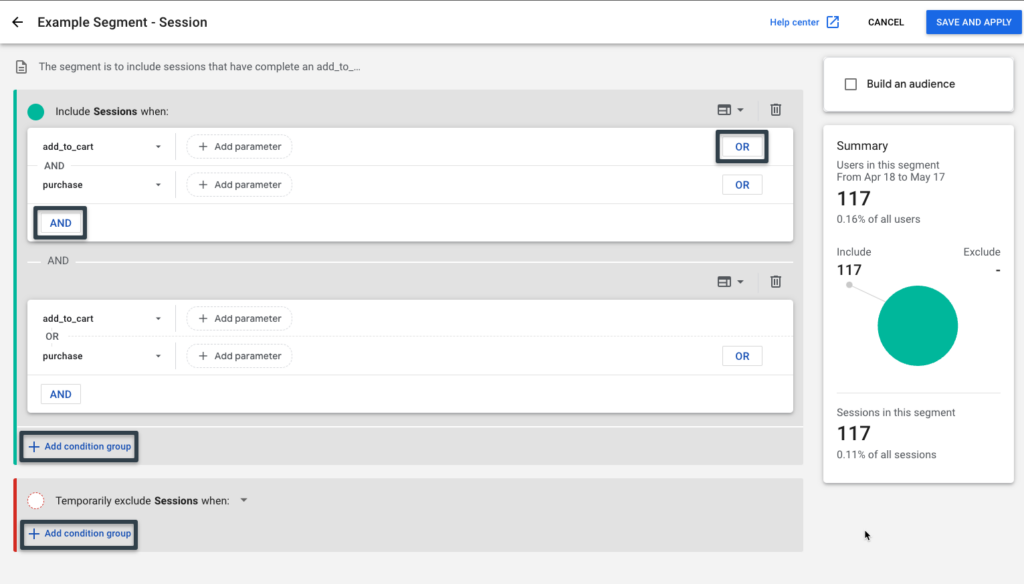
- The first is by accessing the segment builder UI and selecting what kind of segment you wish to build. There are three different custom segments and a few prebuilt suggested segments you can choose to select:
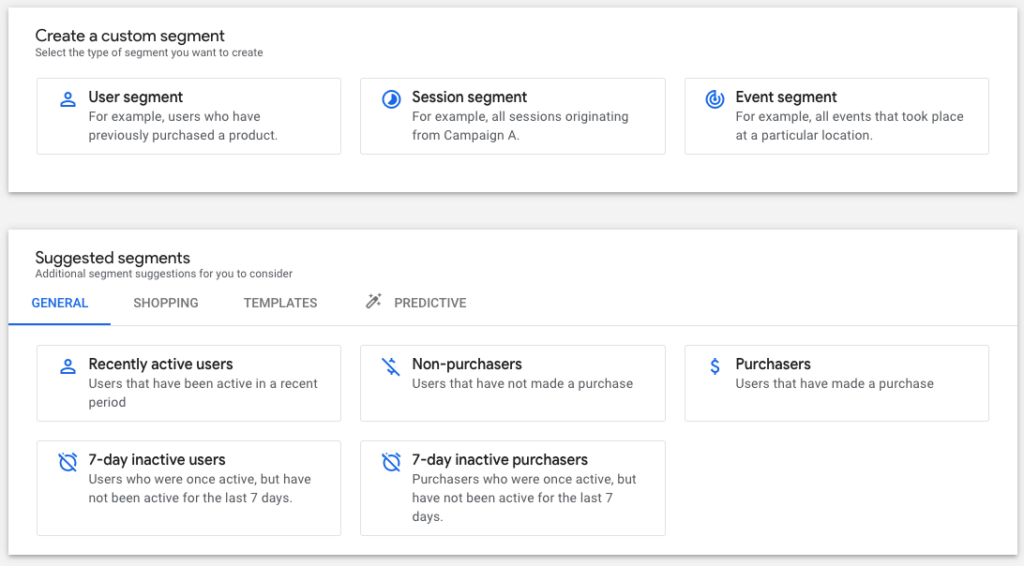
- User Segments – Are used to display and create various subsets of users who fit some given criteria/data point at some point over the selected timeframe. This means that if a user, during one of their few different sessions, completes an event (Add To Cart in the below example) that fulfills the segment filter requirements, then all the other session and events from the selected timeframe for that user will also be included with that segment. An example of this would be the average session duration, or event count would be a summation of all the events and sessions the user completed for the selected timeframe.
- Sessions Segments – Are used to display and create a subset of session specific data if it fits the given segment filters. This means that if a user completes an event (Add To Cart in the below example) that fulfills the segment filter requirements, only the session and all of the data (user interactions) from that session that fits the criteria would be included in the segment. Using the above example, the average session duration or event count would only include a summation of the data from that specific session.
- Event Segments – Are used to create and display a subset of event level data if it fits the given set(s) of segment filters. This means that if a user completes an event (Add To Cart in the below example) that fulfills the segment filter requirements, only the event level data will be included. Thus, if they complete a purchase event of a specific widget and that is what fulfills segment filter requirements, the event count would just include that event, rather than the summation of the total event count of that session.

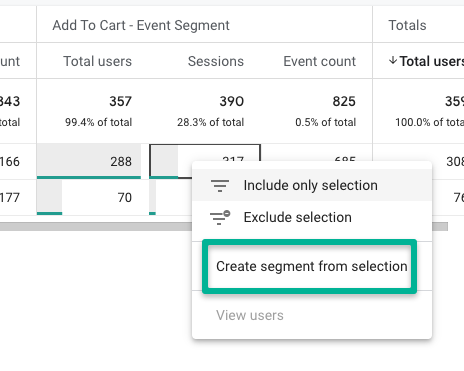
- The second option is actually one of my favorite features in the Explore Report section, no cap. This option is accessed by identifying a group of users either on a graph or in a table cell and right-clicking on that user group. From here, a pop-up will appear and allow users to create a segment. Depending on the type of Exploration Report you right-click on, different segment options may appear. I know—this feature slaps.
Dimensions and Metrics
There are two options when it comes to adding commentary and data to your Exploration Report: adding either dimension or metrics. It is required to add at least one of each before you see any data populate. We won’t get to into the weeds when it comes to dimensions and metrics in this article, but there are a few things I want to draw your attention to:
- There are two kinds of dimensions and metrics, predefined and custom defined. Predefined parameters are parameters that are defined by Google without the need of any action by the users. Custom-defined parameters are parameters that are defined by the user and are typically due to a custom analytics implementation. Custom-defined parameters must be set up/registered in the GA4 property to be able to be used in the Explore Report section.

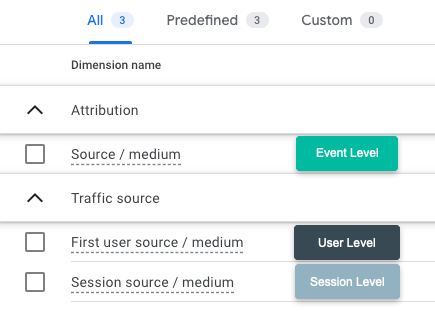
- There are some dimensions and metrics that are like oil and water—they don’t mix. Typically the easiest way to find out which dimension and metric doesn’t work together is by waiting until the report breaks. One of the most common mistakes I come across is the mixing of different dimension levels. For example, there are three dimensions for each UTM parameter: Source (Event Level), Sessions Source (Session Level), and First User Source (User Level). I tend to prefer utilizing session-level parameters as these seem to cause the least amount of breakage.
Tab Settings Column
Now that we have some facts on the Variable column we can move on to the Tab Settings column. The Tab Settings column is specific to the Exploration tab you are editing in that given moment. When you switch from one tab or visualization to the next, you will see this column change and update with different settings. We will dive into a few of the common settings in this section of the article.
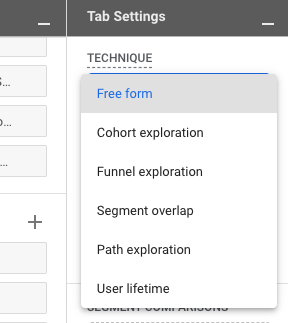
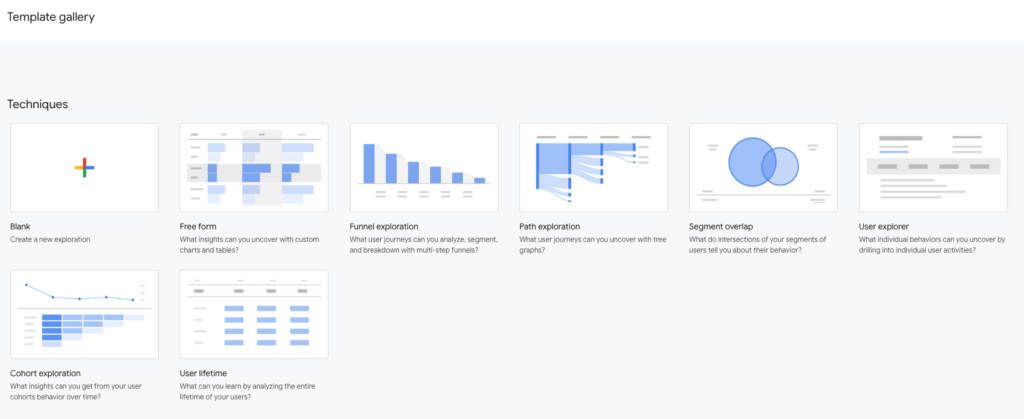
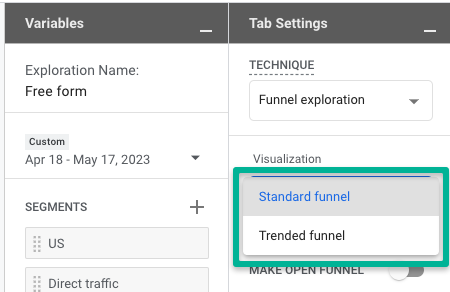
Technique
The technique of an Exploration refers to the kind of analysis you are interested in developing. Currently, there are seven different techniques that are available to use: Free Form, Funnel Exploration, Path Exploration, Segment Overlap, User Explorer, Cohort Exploration, and User Lifetime.
Each of these techniques hits different depending on what use case you are hoping to solve with your analysis. If you are trying to determine what technique you should use, I recommend referring to one of our previous articles, “Where Did All the Reports Go in Google Analytics 4?: Exploration Reports”.
Visualization
The visualization setting allows users to switch between different ways of looking at the data. Not every technique has the ability to switch how the default report visualizes data, but a majority of them do. If you wish to switch between visualizations, you have many to choose from.
For example, the Free From Exploration Report has six different reports to choose from such as table, donut chart, line chart, scatterplot, bar chart, and map. Obviously it will be important to choose the visualization you wish to use carefully, but sometimes switching up the visualization style can help expose something that previously didn’t catch your eye or help you paint a better picture for the story you want to tell.

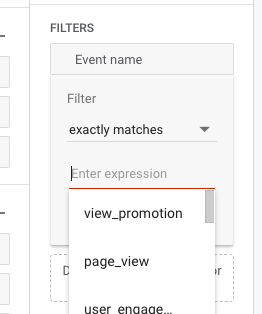
Segment Comparison and Filters
I have combined both segments and filters into one section because they can be used together to attain the desired/analysis data or you can just rely on one. If the user decides to use them together, it is important to ensure that they are not contradicting each other. Filters ultimately have the last say in what is included in the report so if you are not seeing data populate then I would recommend checking to ensure there is no contradiction between your segments and filters.
When it comes to determining which one you should use to attain your desired outcome and built out your lit report, I would recommend thinking about what you hope to accomplish:
- If you wish to include multiple and/or statements and don’t want to build out an extensive RegEx formula to do so, then I would suggest utilizing segments as there is more flexibility. The condition requirements that segments offer are the same as filters, but like how Universal Analytics view filters use to operate, filters are applied in order and once data is excluded you can not re-include it without removing the filter.
- If you wish to apply the same filtering capabilities to other tabs in the Explore Report, it is once again recommended to utilize segments to make this more easily accomplished, as well as maintain consistency. Filters are currently unable to be copied and reapplied to different explorations within the same Explore Reports whereas segments are to be.
- If you wish to only remove a subset of data from a specific exploration, then this will best be completed utilizing a filter. If you edit a segment that is applied to multiple Exploration Reports, then that change will affect all reports that segment is applied to. Therefore, if you wish to just exclude a specific data point from one of your Exploration Report tabs, filters will be the best vehicle to accomplish this.
- The last thing to note is the ability to apply multiple different segments and filters at the same time. You can apply up to four segments and 10 filters at the same time on a given Exploration tab. While this could be tricky to accomplish, if done well, utilizing a combination of filters and segments can take your report to the next level.
Populating Your Reports with Data
Populating your reports with data depends on the Exploration Technique and visualization style you chose. A majority of the Exploration Techniques leverage either one or a combination of the following capabilities when it comes to populating your data:
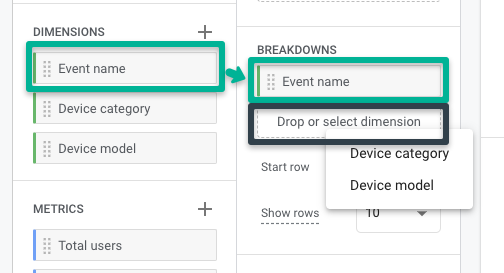
- Breakdowns – Allows users to add either one or multiple dimensions to help break down the data set into more actionable insights. A majority of the Exploration Techniques utilize the breakdown function and allow users to apply multiple dimensions at once. If too many dimensions are applied at once, it can make it difficult to fully understand, especially if there is an ability to apply multiple values.
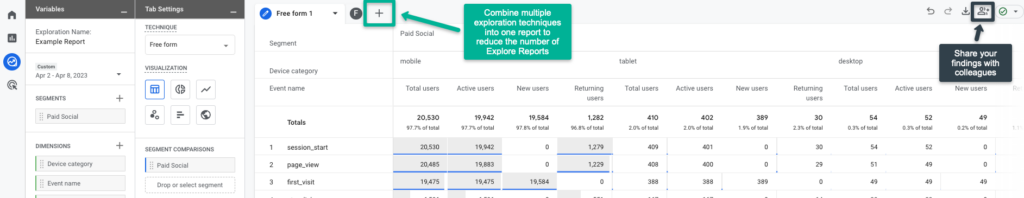
- Rows and Columns – If there is no ability to apply a breakdown to an Exploration Report, then it likely means that you have the ability to apply your dimensions to rows and columns. As it sounds, rows and columns are used to help display data when utilizing a table styled visualization. To follow best practice, it is typically best to apply only one or two dimensions with three or less values to the columns setting at any particular point. If there are more than this applied at one time, then you may risk making your Exploration Report too difficult to understand. This is due to the fact that both applied segments and values also utilize columns to help visualize the data in tables (as seen below).

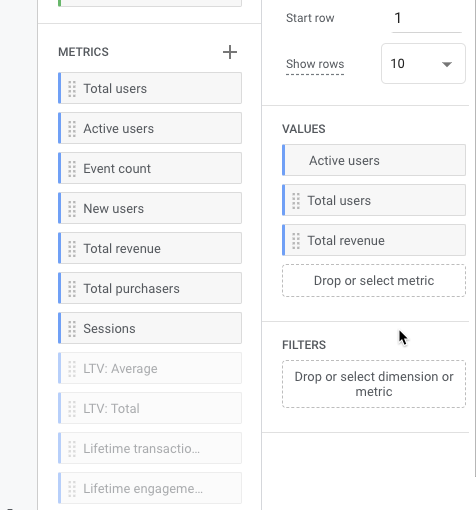
- Values – Are used to allow users the ability to determine the metric(s) they would like to see the rows and columns or breakdowns displayed by. Once again, it depends on the Exploration Technique that is selected that determines the number of values that can be applied at one time. It is also important to note that there are some values that can only be applied to specific Exploration Techniques (grayed out if unable to be applied), such as the User Lifetime and Predictive metrics.
GA4 Explore Report Limits
Before we send you on your way to create some of the most boujee Explore Reports known to humankind, there are some important limits to be aware of and ways to not hit the limits as easily:
- The first limit has to do with the number of tabs and Explore Reports within a particular property. You can create up to 10 tabs with various combinations of Exploration Techniques per Explore Report. It is recommended to leverage as many tabs within one report as possible, because only 200 Explore Reports can be created per user per property and 500 (Standard License) or 1000 (GA4 360 License) can be shared with other users within one property. Due to this, it is important to stay on top of the number of reports that are created and shared with the organization.
- The other limit to be aware of is the number of rows or data points that are able to be viewed utilizing a given Exploration Technique. Currently, tables have a limit of viewing up to 500 rows and 20 columns, while other techniques such as funnel only enables users to view up to 15 rows per funnel step. Now before you clapback at me due to these limits, there is an option to export all the data from the Exploration Report to a wealth of various options. These options include Google Sheets, TSV, CSV, PDF, and PDF (all tabs).

- The last limit to be aware of is the number of dimensions and metrics that can be applied to an Explore Report at one time. You are able to apply up to 20 dimensions and 20 metrics per report. Out of the 20 dimensions, you can apply up to five dimensions per row or breakdown (excluding funnel and cohort exploration techniques) and two per column (for tables).
As we wrap up this article, I thought that it would be appropriate to let the fam that made it this far in on the last sip of tea. InfoTrust is committed to helping our clients navigate the ever-changing world of what it means to become a privacy-centric marketing organization. We are so high-key committed to helping that we even wrote a book on it. While GA4 is a step in the right direction, InfoTrust can help your organization determine a future-focused path to help you achieve your privacy-centric marketing objectives.
I also hope that you had a few, “Sending me” or, “I’m weak” moments with a few of the latest and greatest Gen Z terminology.
Gen Z Term Dictionary
Just as a little reference for you to be able to be hip with the times, here is your own little Gen Z dictionary of the words used above:
- Bet – Similar to saying watch me do this, yes, or hold my beer
- Boujee – Used to describe something as fancy or extravagant
- Dank – Implying that something is of very high quality
- Fam – Way to address people you are close to, similar to calling someone family
- High-key – A way of saying someone is very public about something
- Hits Different – Describing something that is unique and better than usual
- I’m weak – Another way of acknowledging something as hilarious
- Periodt – Used to add emphasis to something
- Rent Free – That lives in the head of someone that can’t stop thinking obsessively about that thing
- Sending me – A way of acknowledging something as particularly funny
- Slaps – Used to describe something as exceptional
- Tea – Information that someone gossips or has insider knowledge of
- This ain’t it, chief – A way to give disapproval of something